The USD/JPY pair started falling almost immediately on Monday, reaching down towards the 108.50 level. If we bring to a fresh, new low, I think that this
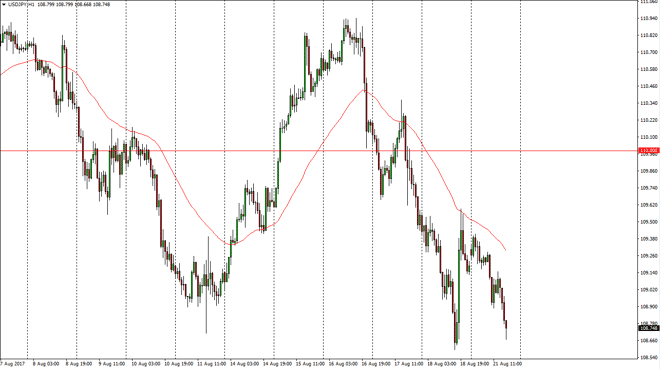
The USD/JPY pair started falling almost immediately on Monday, reaching down towards the 108.50 level. If we bring to a fresh, new low, I think that this pair probably goes looking towards the 105 level over the longer term. If we bounce from here, it should show signs of extreme support, and that perhaps the market will try to find its way back to the 110 handle. I don’t know that’s going to happen though, so I suspect that there is more of a bearish bias in this market. A break above the 110 level would be a complete repudiation of the selloff, but right now I think that the Japanese yen is the hottest currency in the Forex world, so it makes sense that we may continue to see the downside.
Chris is a proprietary trader with more than 20 years of experience across various markets, including currencies, indices and commodities. As a senior analyst at FXEmpire since the website’s early days, he offers readers advanced market perspectives to navigate today’s financial landscape with confidence.