The USD/JPY pair went back and forth on Monday, as we continue to test the 30.2% Fibonacci retracement level. This is an area that should continue to
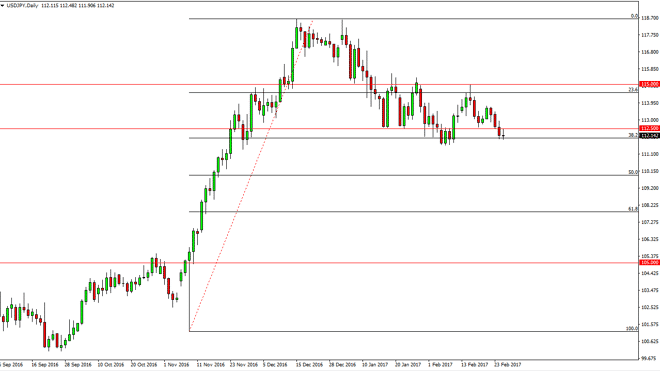
The USD/JPY pair went back and forth on Monday, as we continue to test the 30.2% Fibonacci retracement level. This is an area that should continue to offer support, and I think the support runs down to roughly 111.50. If we can break down below there, then I believe the market reaches towards the 110 level which is essentially the 50% Fibonacci retracement level. Alternately, if we can reach above the 112.50 level, the market should then go to the 115 handle. Longer-term, I still believe that the market is going to go higher, but we may need to pull back.
Chris is a proprietary trader with more than 20 years of experience across various markets, including currencies, indices and commodities. As a senior analyst at FXEmpire since the website’s early days, he offers readers advanced market perspectives to navigate today’s financial landscape with confidence.