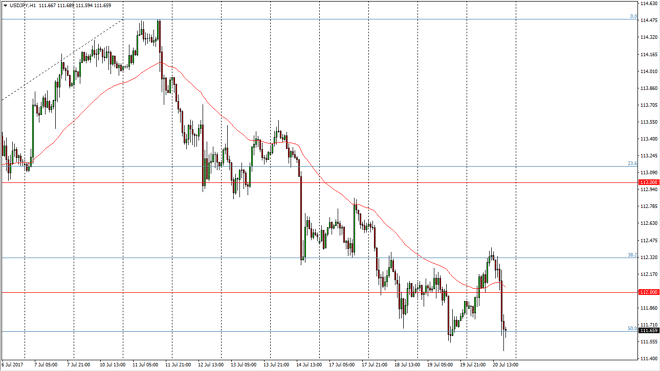
The USD/JPY pair initially tried to rally during the day, but found enough resistance near the 112.32 level to turn around and drop significantly.
The USD/JPY pair initially tried to rally during the day, but found enough resistance near the 112.32 level to turn around and drop significantly. However, by the end of the day we are starting to find support near the 50% Fibonacci retracement level from the most recent major move, so I think that the market will continue to be very choppy. Simply put, if we can break down below the 111.50 level, I feel that the downtrend continues, perhaps down to the 111 level, and possibly even the 110 level. Alternately, if we break above the highs from the session, that would be a very bullish sign and should send this market to the upside, reaching towards 113, and then eventually the 114.50 level. I think the one thing you can count on is a significant amount of volatility, so ultimately this is a market that continues to see a significant amount of trouble.
A lot of this noise during the day was due to announcements that investigators are considering the various global companies that Donald Trump owns, for collusion with Russia. While they did not say that they found anything, this seems to have scared several traders, and we had the US dollar selloff drastically during the day. I believe that given enough time it’s likely to turn around, but the question now is whether we can turn around here, or at lower levels.
Chris is a proprietary trader with more than 20 years of experience across various markets, including currencies, indices and commodities. As a senior analyst at FXEmpire since the website’s early days, he offers readers advanced market perspectives to navigate today’s financial landscape with confidence.