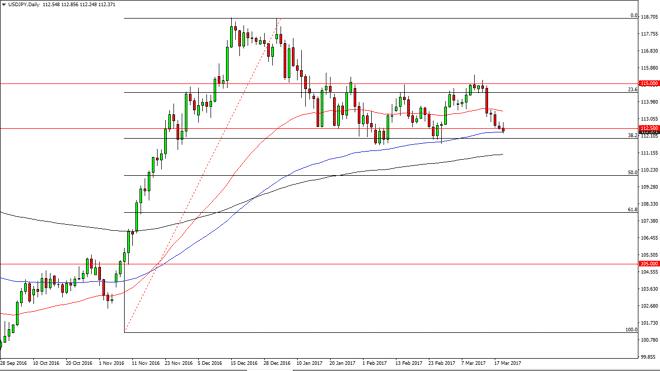
The USD/JPY pair initially tried to rally on Tuesday but found enough resistance above the 112.50 level to turn things around and form a negative candle.
The USD/JPY pair initially tried to rally on Tuesday but found enough resistance above the 112.50 level to turn things around and form a negative candle. By doing so, looks as if were going to test the 112 handle. That’s an area where I expect to see support, so I’m going to wait to see whether or not we can close below there before I would consider selling. Alternately, if we find some type of supportive candle, then I’m willing to buy as it is the bottom of the most recent consolidation area.
Chris is a proprietary trader with more than 20 years of experience across various markets, including currencies, indices and commodities. As a senior analyst at FXEmpire since the website’s early days, he offers readers advanced market perspectives to navigate today’s financial landscape with confidence.