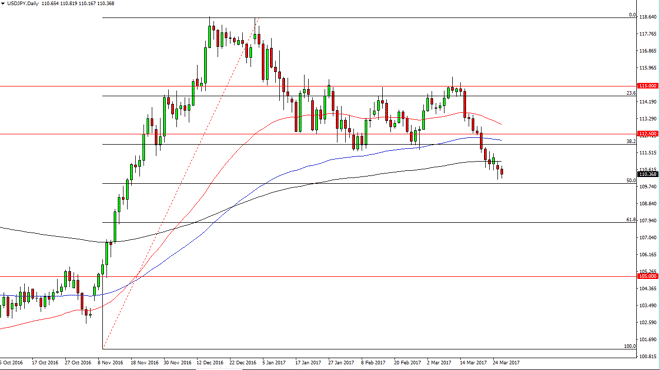
The USD/JPY pair initially fell during the session on Tuesday but found enough support below to turn things around again. It appears that the 50%
The USD/JPY pair initially fell during the session on Tuesday but found enough support below to turn things around again. It appears that the 50% Fibonacci retracement level is going to continue to offer a bit of dynamic support, and with this being the case if we can break back above the 200-exponential moving average, pictured in black on the chart, then I think the buyers may return. Alternately, if we break down below the 50% Fibonacci retracement level, we then will more than likely reach towards the 108 handle, which is near the 61.8% Fibonacci retracement.
Chris is a proprietary trader with more than 20 years of experience across various markets, including currencies, indices and commodities. As a senior analyst at FXEmpire since the website’s early days, he offers readers advanced market perspectives to navigate today’s financial landscape with confidence.