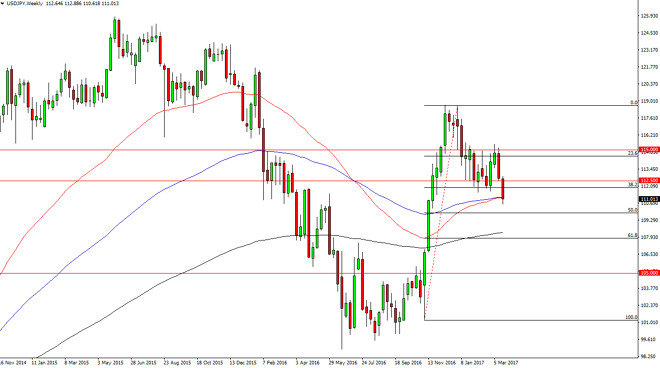
The USD/JPY pair broke down during the week, slicing through the 112 handle. If we can break down below the bottom of the candle for the week, I believe
The USD/JPY pair broke down during the week, slicing through the 112 handle. If we can break down below the bottom of the candle for the week, I believe that the market will reach towards the 110 level. Any type of supportive candle in that area could be a buying opportunity as it is near the 50% Fibonacci retracement level, but I believe in the short term we are going to see a little bit more bearish pressure. If we broke above the 112.50 level, that could be very bullish though.
Chris is a proprietary trader with more than 20 years of experience across various markets, including currencies, indices and commodities. As a senior analyst at FXEmpire since the website’s early days, he offers readers advanced market perspectives to navigate today’s financial landscape with confidence.