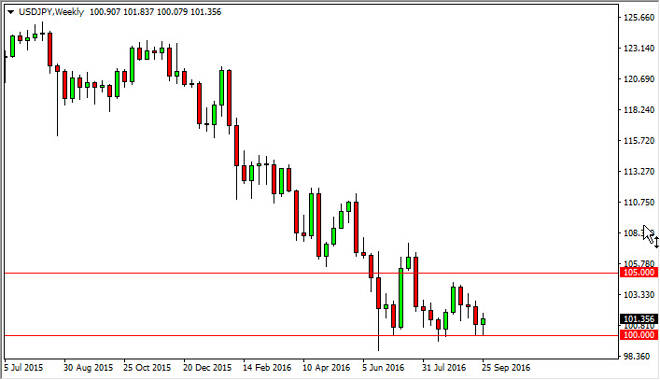
The USD/JPY pair initially fell during the course of the week but found enough support at the 100 level to bounce and form a hammer. I believe that the
The USD/JPY pair initially fell during the course of the week but found enough support at the 100 level to bounce and form a hammer. I believe that the 100 level continues to be supported by the Bank of Japan, and given enough time I think we will see the market turned around completely. However, I think it’s very difficult to deal with this potential trend changing opportunity on a longer-term chart. Short-term charts are probably best used to find a bounces that you can take advantage of.
Chris is a proprietary trader with more than 20 years of experience across various markets, including currencies, indices and commodities. As a senior analyst at FXEmpire since the website’s early days, he offers readers advanced market perspectives to navigate today’s financial landscape with confidence.