
Advertisement
Advertisement
USD/JPY Monthly Technical Analysis for August 2015
By:
A strong finish by U.S. equity markets and talk of a Fed rate hike perhaps in September helped the USD/JPY rebound into the close after a dismal start.
A strong finish by U.S. equity markets and talk of a Fed rate hike perhaps in September helped the USD/JPY rebound into the close after a dismal start.
This month could be volatile and may feature a two-sided trade. Bullish traders are being driven by the strong possibility of an interest rate hike by the Fed in September. Bearish traders are looking at the possibility of increased carry trade selling related to stock market selling.
With the possibility of a September Fed rate hike on the minds of investors, the primary focus this month will be on the Friday, August 7 U.S. Non-Farm Payrolls report. This is because the Fed cited the improving labor market as one reason why it is leaning towards raising interest rates. Early estimates are predicting the economy added 224K new jobs in July.
A substantially higher number will increase the odds of a September rate hike. This would be bullish for the U.S. Dollar. A substantially lower number will likely take a September hike off the table, forcing traders to price in a December rate hike. Gains and losses will be limited, however, by the price action in the U.S. stock market. A lower market will be supportive for the Japanese Yen. A higher stock market will likely underpin the USD/JPY.
On August 6, the Bank of Japan will release its monetary policy statement. It is likely to leave monetary policy unchanged, but may reference the weak Japanese Yen and its impact on the economy.
The wildcard this month remains the Chinese stock market. Another collapse in Chinese equities could send the USD/JPY plunging as investors are likely to plow into the safe-haven Japanese Yen.
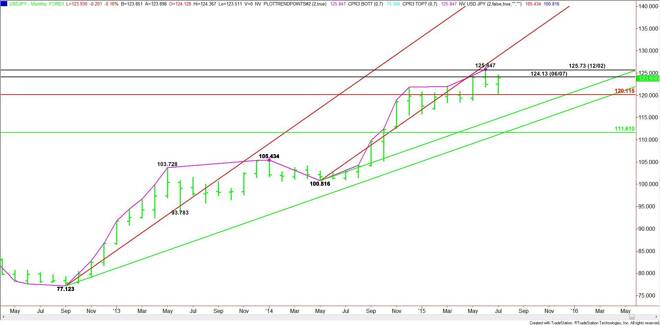
Technically, the main trend is up according to the monthly swing chart, but the market is still under the influence of the potentially bearish closing price reversal top from June. This chart pattern was confirmed last month, but there wasn’t much of a follow-through to the downside.
Overcoming a former top at 124.13 will be the first sign of strength. Overtaking this level could drive the market into 125.73 to 125.85. Taking out this level with conviction will negate the reversal chart pattern. This could trigger an acceleration to the upside with 130.82 a potential target. This could occur if the stock market takes off to the upside.
On the downside, the first support is a major Fibonacci level at 120.115. This level stopped the selling in July. The daily chart opens up under this level with the next likely target an uptrending angle at 115.82.
The jobs report on August 7 is going to have a lot to do with the price action this month. A stronger-than-expected number will likely trigger a rally strong enough to take out the reversal top at 125.85. A weaker-than-expected non-farm payrolls number will likely to trigger a resumption of the selling which began in June.
About the Author
James Hyerczykauthor
James Hyerczyk is a U.S. based seasoned technical analyst and educator with over 40 years of experience in market analysis and trading, specializing in chart patterns and price movement. He is the author of two books on technical analysis and has a background in both futures and stock markets.


Advertisement