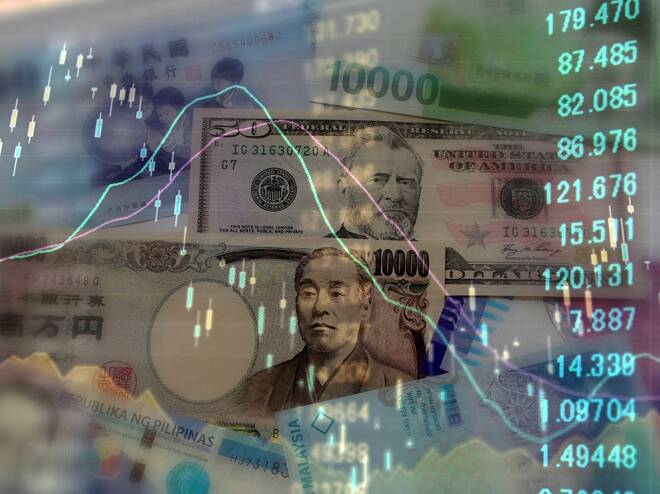
The major support according to the daily chart was the May 29, 2018 main bottom at 108.114. This chart showed that sellers had a clean shot at 104.600, which makes me wonder if it was actually a “flash crash”, or a well-played strategy to break the Dollar/Yen.
Traders are saying that a technically-based “Flash Crash” drove the U.S. Dollar, the Australian Dollar and the New Zealand Dollar sharply lower against the Japanese Yen early Thursday. A torrent wave of automated selling against the Yen sent the Aussie plunging to multi-year lows. The greenback declined against the Yen to its lowest level since late March 2019. The Kiwi spiked lower, but losses were limited.
According to Reuters, the Australian Dollar suffered some of the largest intra-day losses in its history amid a “drought of liquidity and a cascade of computerized sales.”
The daily chart shows that a one point the Australian Dollar was down 5 percent against the Japanese Yen and almost 4 percent versus the U.S. Dollar, before clawing back much of the losses as trading conditions calmed and humans intervened to stabilize the markets.
According to Ray Attrill, head of FX strategy at National Australia Bank (NAB), “Violent moves in the AUD and JPY this morning bear all the hallmarks of a ‘flash crash’ similar to that which befell the NZD in August 2015 and GBP in October 2016.”
Attrill went on to say, “The fact that over half the move down in both these pairs has since been retraced is testimony to today’s moves being first and foremost a liquidity event.”
The daily USD/JPY chart supports the theory that Japanese investors who had been crowded into trades borrowing Japanese Yen to buy higher-yielding currencies, were forced out en masse when major chart levels were pierced. This chart shows former bottoms that failed this week at 109.770, 109.360 and 109.179. This left just one more level as support.
The major support according to the daily chart was the May 29, 2018 main bottom at 108.114. This chart showed that sellers had a clean shot at 104.600, which makes me wonder if it was actually a “flash crash” fueled by human or computer error, or a well-played strategy to break the Dollar/Yen. I tend to lean toward the side of a good trader or group of traders in this case. They saw opportunity and they seized it.
Touche’.
James Hyerczyk is a U.S. based seasoned technical analyst and educator with over 40 years of experience in market analysis and trading, specializing in chart patterns and price movement. He is the author of two books on technical analysis and has a background in both futures and stock markets.