
Advertisement
Advertisement
AUD/USD Forex Technical Analysis – November 5, 2015 Forecast
By:
After four days of higher-highs and higher-lows, the AUD/USD sold-off on Wednesday, following a failed attempt to take out an important 50% level. The
After four days of higher-highs and higher-lows, the AUD/USD sold-off on Wednesday, following a failed attempt to take out an important 50% level. The selling pressure was related to increasing concerns that the U.S. Federal Reserve is gearing up for a rate hike in December.
Follow-through selling came in early in Thursday’s session after Australia’s central bank Governor Glenn Stevens said accommodative monetary policy is likely to be appropriate “for some time yet”, while adding the macroeconomic impact of recent mortgage rate increases by major banks “may not be large.”
“It seems likely that an accommodative stance will be appropriate for some time yet,” Stevens said in the address Thursday. “Were a change to monetary policy to be required in the near term, it would almost certainly be an easing, not a tightening. Certainly the rate of CPI inflation wouldn’t be an impediment to that if we thought it was useful to do it. “
Traders interpreted Stevens’ speech to mean the RBA is likely to cut interest rates two times within the next year. Traders are pricing in a 25 percent chance of a rate cut in December, rising to a more than 60 percent chance in February.
Investors are pricing in the chance of a December rate hike by the Fed at 50%. This Friday’s U.S. Non-Farm Payrolls report is likely to provide the central bank with enough evidence that the economy is strong enough to handle a rate hike by the end of the year.
A rate hike in December by the Fed and a rate cut by the RBA at the same time would likely drive the AUD/USD sharply lower. Yesterday’s price action may be an indication that short-sellers are already betting on the worst case scenario.
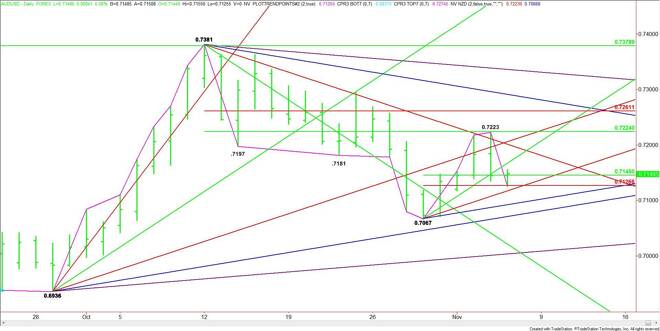
Technically, the main trend is up according to the daily swing chart, but the short-term price action indicates that momentum may have shifted to the downside with the formation of a secondary lower top at .7223.
The main range is .7381 to .7067. Its 50% level is .7224. This level stopped the rally on Wednesday when the AUD/USD traded .7223.
The new short-term range is .7067 to .7223. Its short-term retracement level at .7145 to .7127 is the primary downside target. This zone was tested earlier in the session and attracted enough buying interest to produce a technical bounce to the upside.
Based on yesterday’s close at .7144, a sustained move over .7145 will indicate the presence of buyers. This could trigger a rally into a short-term uptrending angle at .7167. Overtaking this angle will set up the market for a rally into the longer-term downtrending angle at .7201.
A sustained move under .7145 will signal the presence of sellers. The first downside objective is the Fibonacci level at .7127. This is followed closely by a short-term uptrending angle at .7117.
The daily chart opens up further to the downside under .7117 with the next target another short-term uptrending angle at .7092. This is the last potential support angle before the .7067 main bottom. A trade through this price will turn the main trend to down.
Watch the price action and read the order flow at .7145 today. Trader reaction to this level will tell us whether the bulls or the bears are in control.
About the Author
James Hyerczykauthor
James Hyerczyk is a U.S. based seasoned technical analyst and educator with over 40 years of experience in market analysis and trading, specializing in chart patterns and price movement. He is the author of two books on technical analysis and has a background in both futures and stock markets.


Advertisement