It's a particularly bearish start to the week for the majors. Failure to revisit early Monday highs would leave support levels in play.
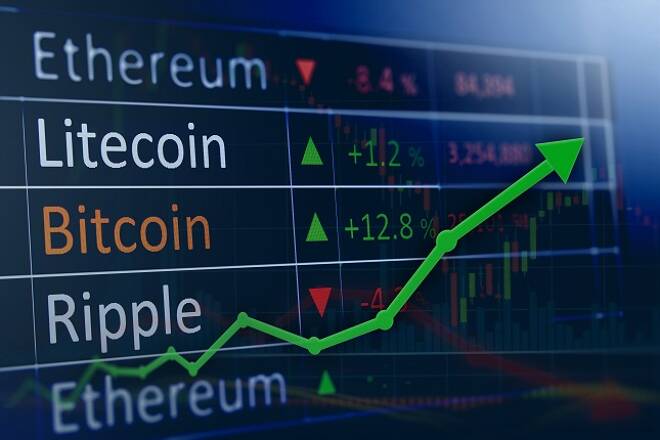
Bitcoin, BTC to USD, rallied by 25.08% in the week ending 14th February. Following on from a 17.27% rally from the previous week, Bitcoin ended the week at $48,584.0.
A mixed start to the week saw Bitcoin fall to a Monday intraweek low $37,947.0 before making a move.
Steering clear of the first major support level at $33,813 and the 23.6% FIB of $33,008, Bitcoin rallied to a Sunday intraweek high and a new swing hi $49,659.0.
Bitcoin broke through the first major resistance level at $42,380 and the second major resistance level at $45,924.
Falling short of $50,000 levels, however, Bitcoin ease back to end the week at sub-$49,000 levels.
4 days in the green that included a 19.59% rally on Monday delivered the upside for the week.
Bitcoin would need to avoid a fall through the $45,397 pivot to support a run the first major resistance level at $52,846.
Support from the broader market would be needed for Bitcoin to break out from 14th January’s swing hi $49,659.0.
Barring an extended crypto rally, the first major resistance level would likely cap any upside.
In the event of an extended breakout, Bitcoin could test resistance at $55,000 before any pullback. The second major resistance level sits at $57,109.
Failure to avoid a fall through the $45,397 pivot would bring the first major support level at $41,134 into play.
Barring an extended sell-off, Bitcoin should steer clear of sub-$40,000 and the 23.6% FIB of $38,338. The second major support level sits at $33,685.
At the time of writing, Bitcoin was down by 3.40% to $46,932.0. A mixed start to the week saw Bitcoin rise to an early Monday high $48,959.0 before sliding to a low $45,730.5.
Bitcoin left the major support and resistance levels untested at the start of the week.
Ripple’s XRP surged by 41.34% in the week ending 14th February. Reversing a 15.35% slide from the previous week, Ripple’s XRP ended the week at $0.59259.
It was a mixed start to the week. Ripple’s XRP fell to a Monday intraweek low $0.41347 before making a move.
Steering clear of the 38.2% FIB of $0.4070 and the first major support level at $0.2532, Ripple’s XRP surged to a Saturday intraweek high $0.6432.
While falling short of the week’s major resistance levels, Ripple’s XRP broke through the 62% FIB of $0.5522 to form a near-term bullish trend.
In spite of a bearish end to the week, Ripple’s XRP avoided a fall back to sub-$0.55 levels on Sunday.
6-days in the green included a 7.69% rally on Monday and an 15.33% rally on Saturday contributed to the upside in the week.
Ripple’s XRP would need to move back through the pivot level at $0.5498 to support a run at the first major resistance level at $0.6860.
Support from the broader market would be needed, however, for Ripple’s XRP to break out from last week’s high $0.6432.
Barring another extended crypto rally, the first major resistance level would likely cap any upside.
In the event of another extended breakout, Ripple’s XRP could test resistance at $0.80 before any pullback. The second major resistance level sits at $0.7795.
Failure to move back through the pivot level at $0.5498 would bring the 23.6% FIB of $0.5320 and the 38.2% FIB of $0.4632 into play.
Barring an extended sell-off in the week, Ripple’s XRP should steer well clear of sub-$0.40 levels, however. The first major support level at $0.4563 should limit the downside.
At the time of writing, Ripple’s XRP was down by 7.38% to $0.54887. A mixed start to the week saw Ripple’s XRP rise to an early Monday high $0.60449 before sliding to a low $0.51117.
Ripple’s XRP left the major support and resistance levels untested at the start of the week.
The early sell-off did see Ripple’s XRP briefly fall through the 23.6% FIB of $0.5320, however.
With over 28 years of experience in the financial industry, Bob has worked with various global rating agencies and multinational banks. Currently he is covering currencies, commodities, alternative asset classes and global equities, focusing mostly on European and Asian markets.