
Advertisement
Advertisement
BTC Eyes a Return to $26,000 on Easing Fed Fear and Bank Contagion
By:
Following a bullish Thursday session, BTC was in the red this morning. However, easing Fed Fear and receding bank contagion risk should deliver further support.

Key Insights:
- It was a bullish Thursday session, with BTC gaining 3.04% to end the day at $25,061.
- Easing bets of a 50-basis point Fed interest rate hike and receding Silicon Valley Bank contagion drove demand for riskier assets.
- Technical indicators are bullish, with $26,000 in view.
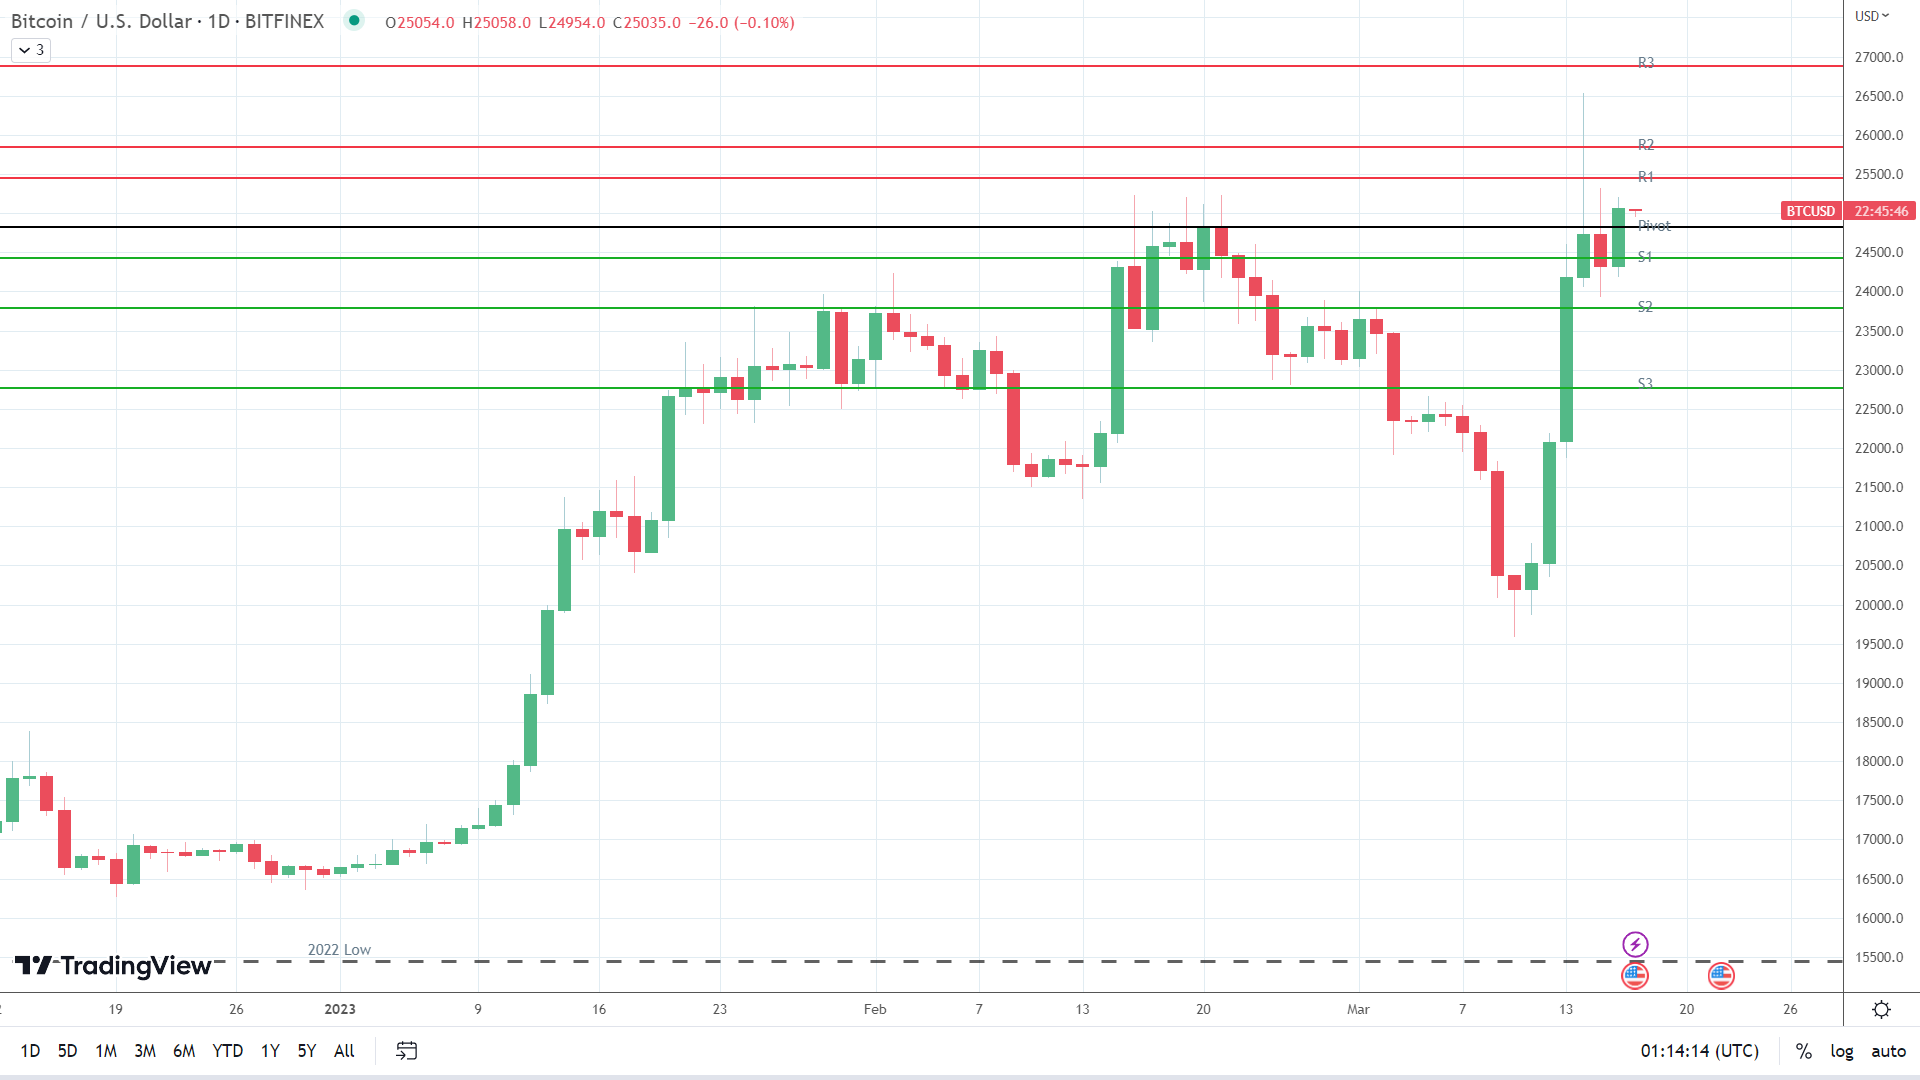
On Thursday, bitcoin (BTC) rose by 3.04%. Reversing a 1.67% loss from Wednesday, BTC ended the day at $25,061. Significantly, BTC held onto the $25,000 handle for the first time since June.
A mixed start to the day saw BTC fall to an early low of $24,186. Steering clear of the First Major Support Level (S1) at $23,727, BTC rose to a high of $25,213. BTC broke through the First Major Resistance Level (R1) at $25,120 before easing back to end the day at $25,061.
Easing Fears of a Global Financial Crisis Supported Riskier Assets
Investor sentiment shifted on Thursday, with fears of a second global financial crisis in 15 years receding. Following the collapse of Silicon Valley Bank (SIVB) and Signature Bank (SBNY), Credit Suisse Group AG (CS) became the market focal point.
However, the Swiss National Bank (SNB) allayed fears of a collapse and echoed assurances from the White House that there would be no banking crisis.
Economic indicators from the US were also crypto-market friendly. Initial jobless claims fell from 212k to 192k, with the Philly Fed Manufacturing Index rising from -24.3 to -23.2. Following the latest inflation and retail sales figures, the numbers on Thursday failed to shift sentiment toward the Fed.
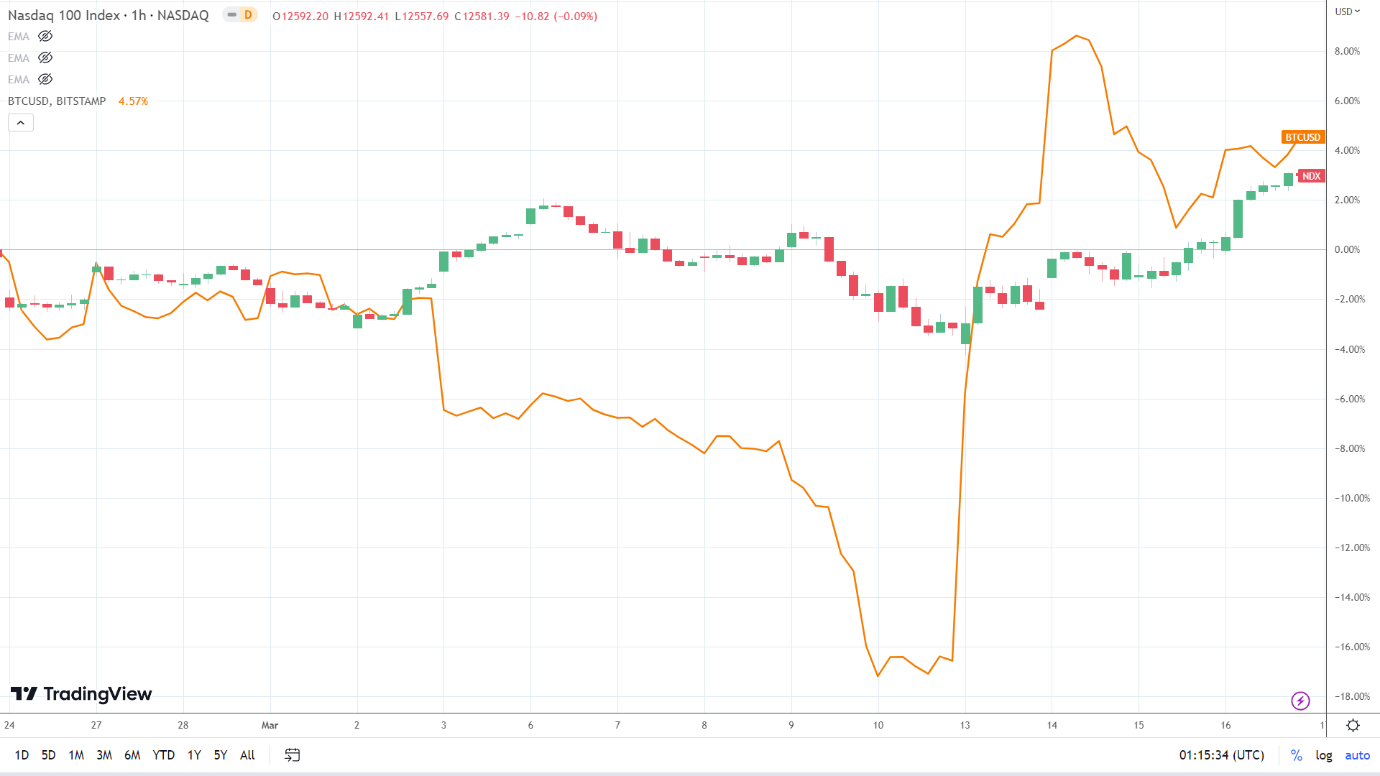
The NASDAQ Composite Index reflected the shift in sentiment, rallying by 2.48%, with the Dow and S&P 500 seeing gains of 1.17% and 1.76%, respectively. Investors are betting on a 25-basis point interest rate hike and a possible post-March pause. The NASDAQ mini was down 4 points this morning.
The Day Ahead
Economic indicators from the US and banking sector-related news will remain the focal points. Prelim Michigan Consumer Sentiment figures for March will draw interest. While the headline figure will move the dial, investors should consider the sub-components, including inflation.
However, the numbers shouldn’t have a material impact on riskier assets, with 50-basis point Fed rate hikes likely off the table.
Beyond the economic calendar, investors should continue to monitor Binance and FTX news and updates from the ongoing SEC v Ripple case.
Bitcoin (BTC) Price Action
This morning, BTC was down 0.10% to $25,035. A range-bound start to the day saw BTC rise to an early high of $25,058 before falling to a low of $24,954.
BTC Technical Indicators
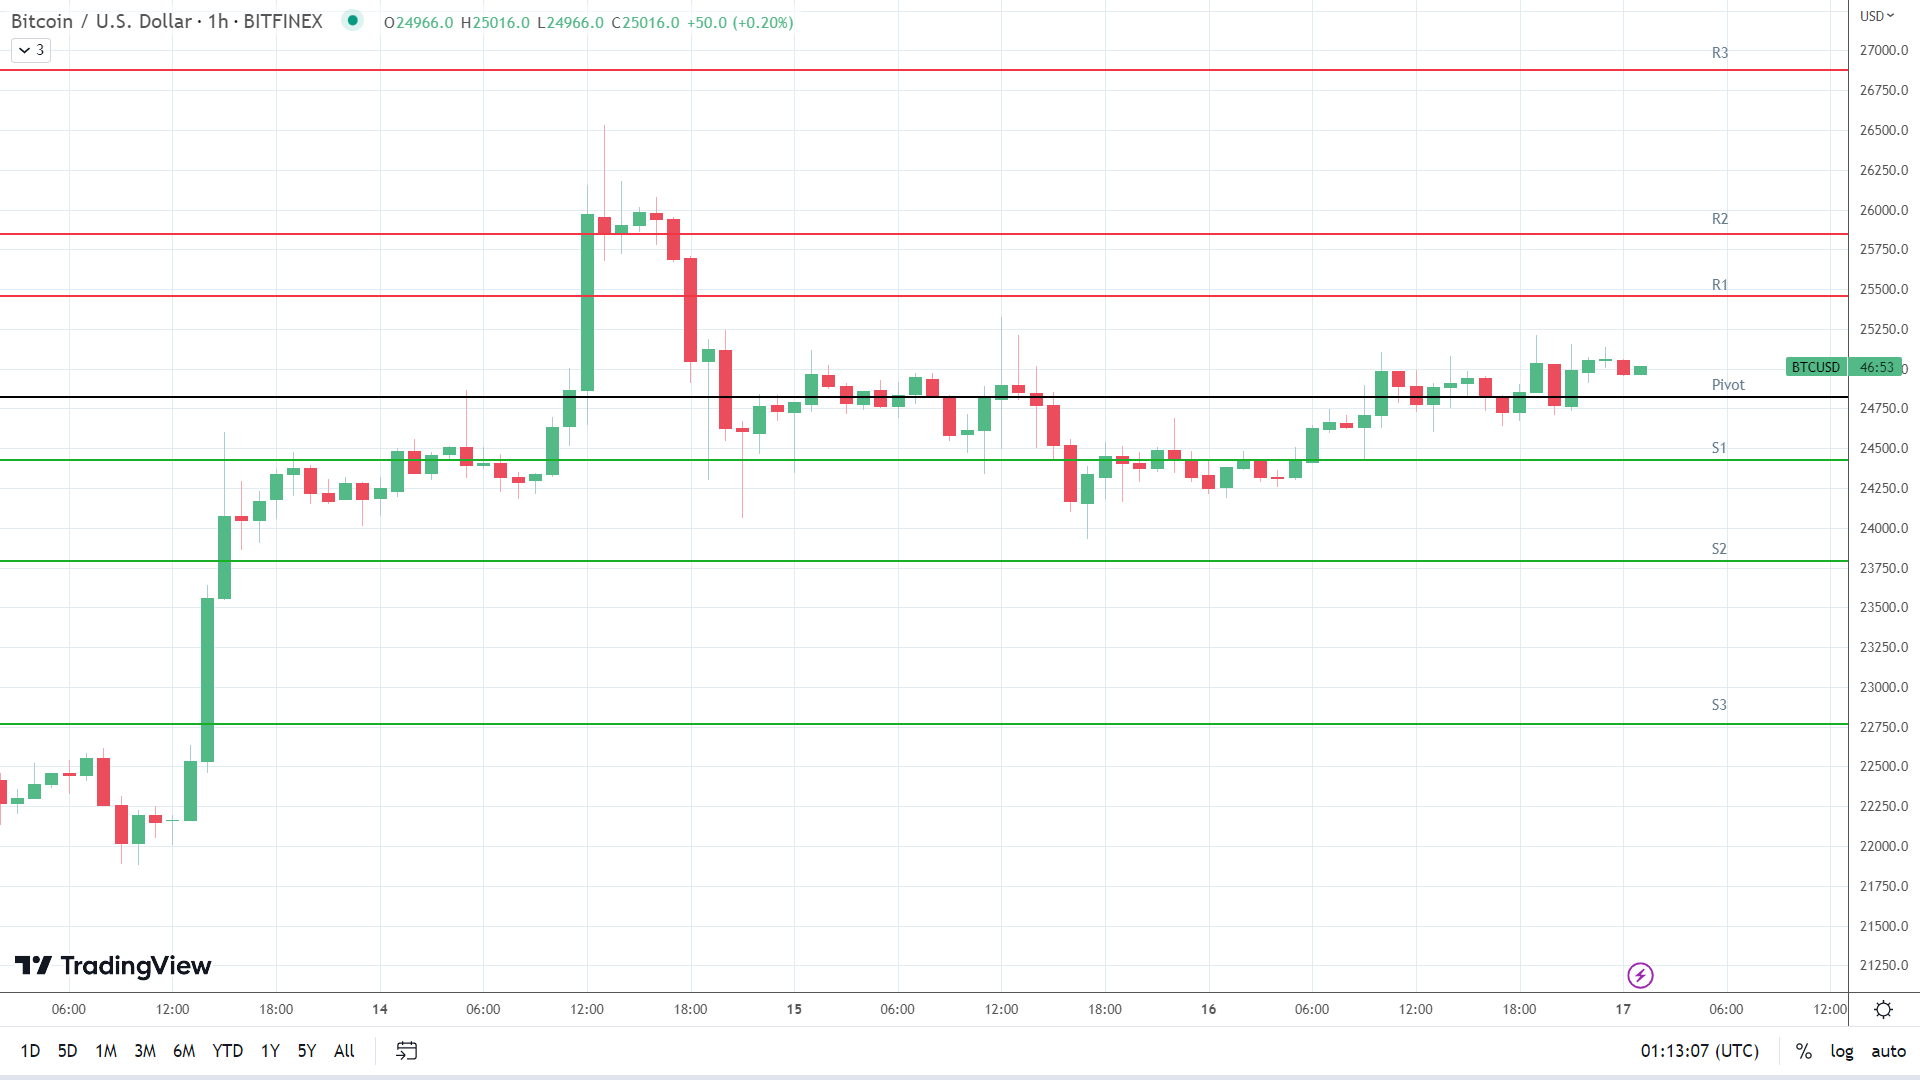
BTC needs to avoid the $24,820 pivot to target the First Major Resistance Level (R1) at $25,454. A move through the Thursday high of $25,213 would signal an extended bullish session. The crypto news wires and economic data should be crypto-friendly to support an extended rally.
In the event of an extended rally, BTC would likely test the Second Major Resistance Level (R2) at $25,847 and resistance at $26,000. The Third Major Resistance Level (R3) sits at $26,874.
A fall through the pivot would bring the First Major Support Level (S1) at $24,427 into play. However, barring a crypto event-fueled crypto sell-off, BTC should avoid sub-$24,000 and the Second Major Support Level (S2) at $23,793.
The Third Major Support Level (S3) sits at $22,766.
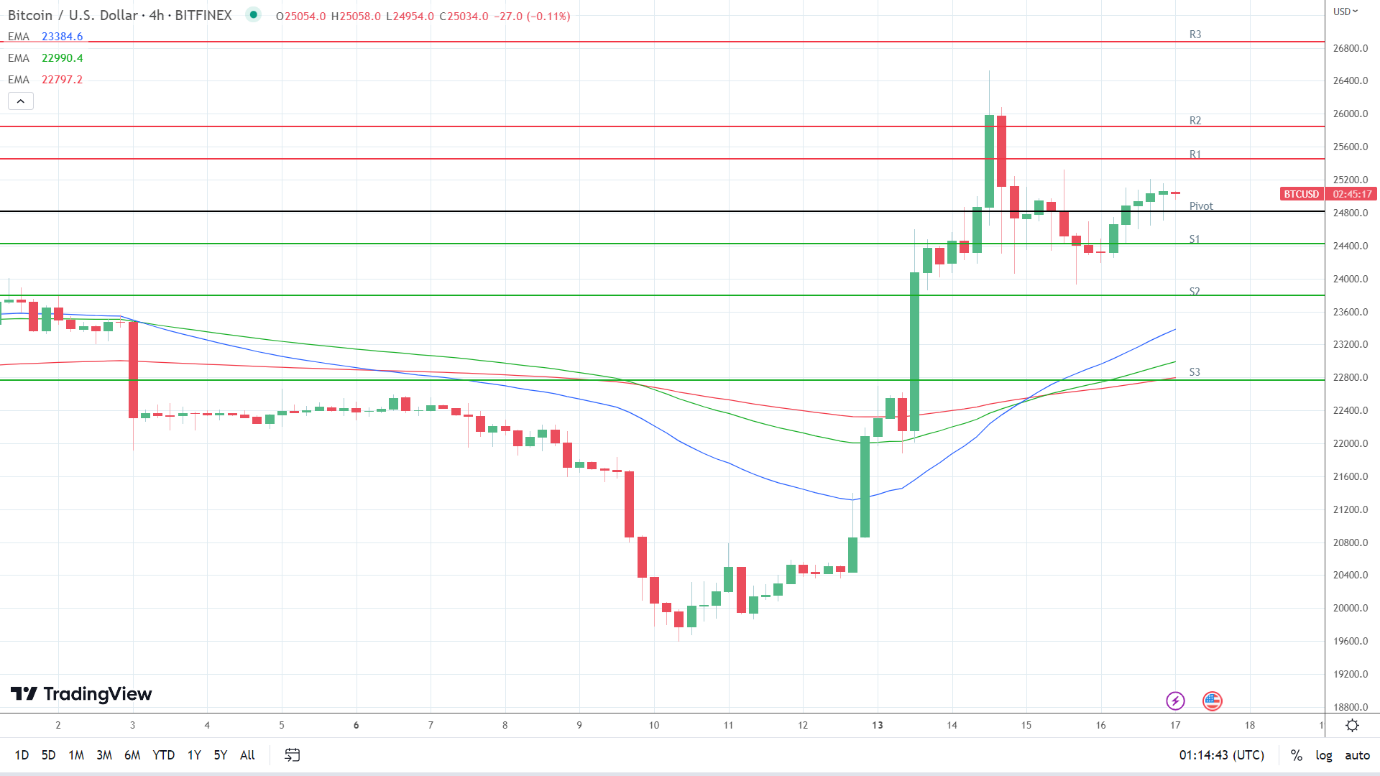
Looking at the EMAs and the 4-hourly candlestick chart (below), it was a bullish signal. BTC sat above the 50-day EMA ($23,385). The 50-day EMA pulled away from the 100-day EMA, with the 100-day EMA moving away from the 200-day EMA, sending bullish signals.
A hold above the 50-day EMA ($23,385) would support a breakout from R1 ($25,454) to target R2 ($25,847) and $26,000. However, a fall through S1 ($24,427) would bring S2 ($23,793) and the 50-day EMA ($23,385) into view. A fall through the 50-day EMA would send a bearish signal.
About the Author
Bob Masonauthor
With over 28 years of experience in the financial industry, Bob has worked with various global rating agencies and multinational banks. Currently he is covering currencies, commodities, alternative asset classes and global equities, focusing mostly on European and Asian markets.


Advertisement