
Advertisement
Advertisement
Comex Gold Futures (GC) Technical Analysis – August 26, 2015 Forecast
By:
December Comex Gold futures traded lower on Tuesday, confirming the previous day’s closing price reversal top. The sell-off reached the short-term
December Comex Gold futures traded lower on Tuesday, confirming the previous day’s closing price reversal top. The sell-off reached the short-term objective, completing the chart pattern. The reversal top doesn’t mean the main trend has changed to down, but it does indicate a shift in momentum to the downside.
The main trend is up according to the daily swing chart. It will turn down on a trade through $1108.50.
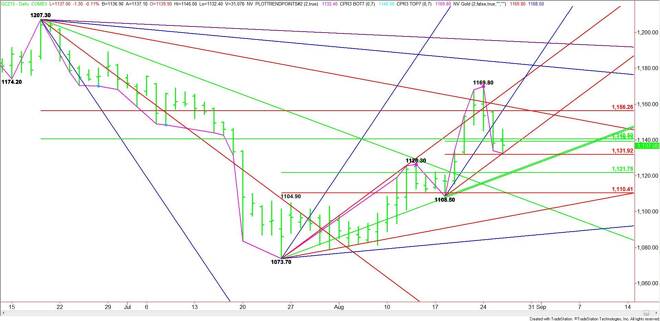
Several ranges are influencing the market at this time. The main range is $1207.30 to $1073.70. Its retracement zone at $1140.50 to $1156.30 is currently resistance.
The intermediate range is $1073.70 to $1169.80. Its retracement zone at $1121.70 to $1110.40 is a potential downside target.
The short-term range is $1108.50 to $1169.80. Its retracement zone at $1139.10 to $1131.90 is currently being tested.
The 50% levels of the main range and the short-term range combine to form a very powerful pivot area at $1139.10 to $1140.50. This area is essentially controlling the direction of the market.
A sustained move over $1140.50 will signal the presence of buyers. This could trigger a rally into the price cluster at $1156.30 to $1156.50. Overtaking the downtrending angle at $1159.30 will signal that the buying is getting stronger. Overcoming the uptrending angle at $1165.70 will put the market in an extremely strong position with the next upside target a downtrending angle at $1183.30.
A sustained move under $1139.10 will signal the presence of sellers. The first downside objective is a price cluster at $1132.50 to $1131.90. This was tested earlier in the session.
If $1131.90 is taken out with conviction then look for the break to extend into another price cluster at $1121.70, $1120.50 and $1119.70. Look for a technical bounce on the first test of this area, but be prepared for an acceleration to the downside if it fails since it is also a trigger point for an acceleration to the downside. The next target is another price cluster at $1111.30 to $1110.40.
Based on the early price action, the direction of the market today is likely to be determined by trader reaction to $1139.10 to $1140.50. Look for a bullish tone on a sustained move over $1140.50 and a bearish tone to develop on a sustained move under $1139.10.
About the Author
James Hyerczykauthor
James Hyerczyk is a U.S. based seasoned technical analyst and educator with over 40 years of experience in market analysis and trading, specializing in chart patterns and price movement. He is the author of two books on technical analysis and has a background in both futures and stock markets.


Advertisement