
Advertisement
Advertisement
Crude Oil Forecast February 23, 2017, Technical Analysis
Updated: Feb 23, 2017, 05:15 GMT+00:00
WTI Crude Oil The WTI Crude Oil market rallied during the day on Wednesday, but then turned around to fill the gap from the Tuesday open. We form a
WTI Crude Oil
The WTI Crude Oil market rallied during the day on Wednesday, but then turned around to fill the gap from the Tuesday open. We form a shooting star on Tuesday, so I think we probably going to see a little bit more negativity in this market over the next couple of sessions. After all, a lot of the reaction to the upside had to do with OPEC claiming that they were trying to reach 100% compliance on output cuts. At the same time, we have massive amount of oversupply in the market and today’s Crude Oil Inventories announcement in the United States should only confirm that. Estimates are that we are going to gain more than 3.4 million barrels, and recently most estimates have been beaten to the upside, which is of course very negative. The matter what OPEC does, it cannot fight American, Canadian, and Mexican production. As a further problem, gasoline is absolutely overflowing in the United States, meaning the demand for crude oil is going to be hampered there as well.
Crude Oil Forecast Video 23.2.17
Watch our Crude Oil Video Forecast:
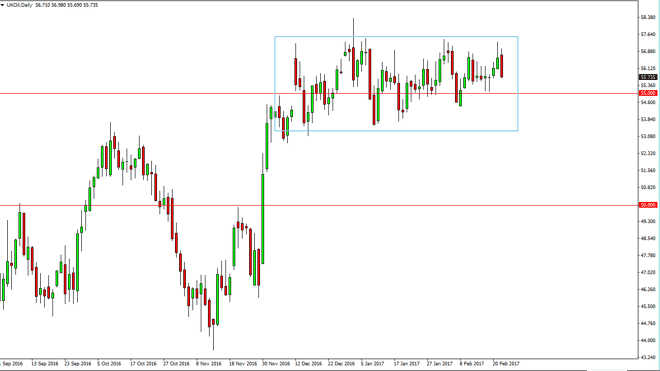
Brent
Brent markets tried to rally during the day as well, but then turned around to form a rather negative candle. I believe that the markets can to try to reach towards the $55 level, perhaps even lower, maybe near the $53.50 level which is the bottom of the consolidation area that we have been in. Because of this, I think that the short-term rallies should be nice selling opportunities. I have no interest in buying this market, at least not until we get towards the bottom of the consolidation area. Longer-term, I still believe in the negative side, but is not until we breakdown below the $53 level that I think we can fall significantly. At that point, I would expect to reach towards the $50 level. If we did break above the $58.50 level, the market should then reach towards the $60 level above, but I don’t think that’s going to happen, that’s my least favorite scenario currently, as I believe the bearish pressure is going to be too much.
About the Author
Christopher Lewisauthor
Chris is a proprietary trader with more than 20 years of experience across various markets, including currencies, indices and commodities. As a senior analyst at FXEmpire since the website’s early days, he offers readers advanced market perspectives to navigate today’s financial landscape with confidence.


Advertisement