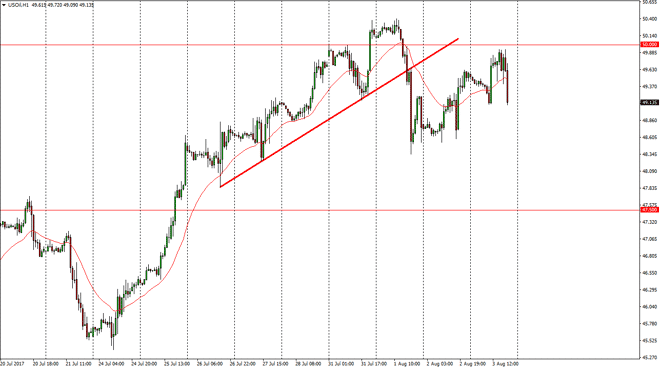
WTI Crude Oil The WTI Crude Oil market initially tried to rally on Thursday, but found significant resistance at the $50 level again, and has rolled over
The WTI Crude Oil market initially tried to rally on Thursday, but found significant resistance at the $50 level again, and has rolled over as we approach to that level. I believe that the sellers are coming back into the marketplace, and we will more than likely see oil drop from here. I have a target of $47.50 underneath, and less we break above the $50.25 level above, which will see the markets continue to go higher. I believe that the market is more bearish though, because quite frankly, the higher oil goes – the more likely we are to see increased American production. If the US dollar strengthens after the jobs report today, that could also put bearish pressure on oil.
Brent markets reached towards the highs again at the $53 level, but then fell just as the WTI market did. I believe that if we drop from here, we should probably go looking towards the $51 level next. A breakdown below there should have the market looking for the $50 handle, and I believe that could be our target. The market should continue to see bearish pressure in general, as the oversupply issues continue. I think that the crude oil markets are towards the top of the longer-term consolidation that we have been in for some time now, so it makes sense that the sellers would return. Keep in mind that the US dollar will be volatile today during the economic announcements coming out, so we could get choppy behavior. However, unless we can break above the $53 level, I don’t have any interest in buying this contract as I think it is getting a bit heavy. Either way, I expect there to be plenty of opportunities to go back and forth during the day with the economic releases.
Chris is a proprietary trader with more than 20 years of experience across various markets, including currencies, indices and commodities. As a senior analyst at FXEmpire since the website’s early days, he offers readers advanced market perspectives to navigate today’s financial landscape with confidence.