


Bullish Breakout and Fibonacci Completion
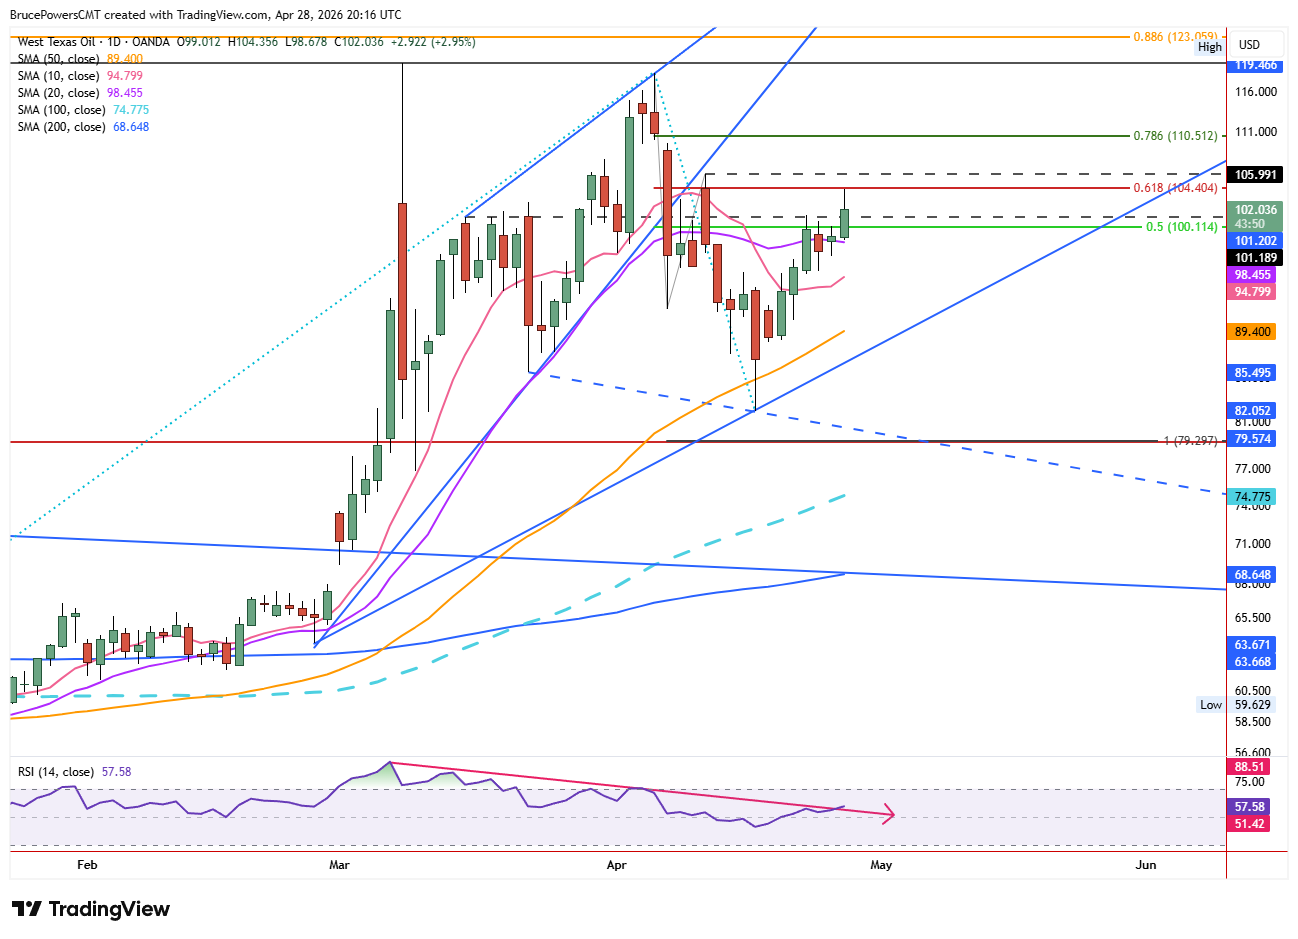
Crude oil continued to strengthen on Tuesday into a new rally high of $104.36, thereby completing a 61.8% Fibonacci retracement before facing signs of resistance. Nonetheless, a daily close above the prior high of $101.36 confirms a bullish continuation and a reclaim of the 20-day moving average. Support near the average was confirmed with the session’s higher daily low of $98.68. The day’s advance triggered a breakout of a small bull pennant, as indicated by two inside days on the daily chart.

Moving Average Reclaim Supports Buyers
A confirmed reclaim of the 20-day moving average suggests that buyers may remain in control until higher prices are reached. At the same time, the market has recognized the 61.8% retracement zone and, therefore, further testing of support near the 20-day average may yet occur. Currently, the 20-day moving average is near $98.48. During the prior advance, the 20-day average was clearly confirmed as dynamic support before breaking during the sharp decline on April 8, highlighting its role as a key short-term trend reference.
Resistance Zones and Upside Targets
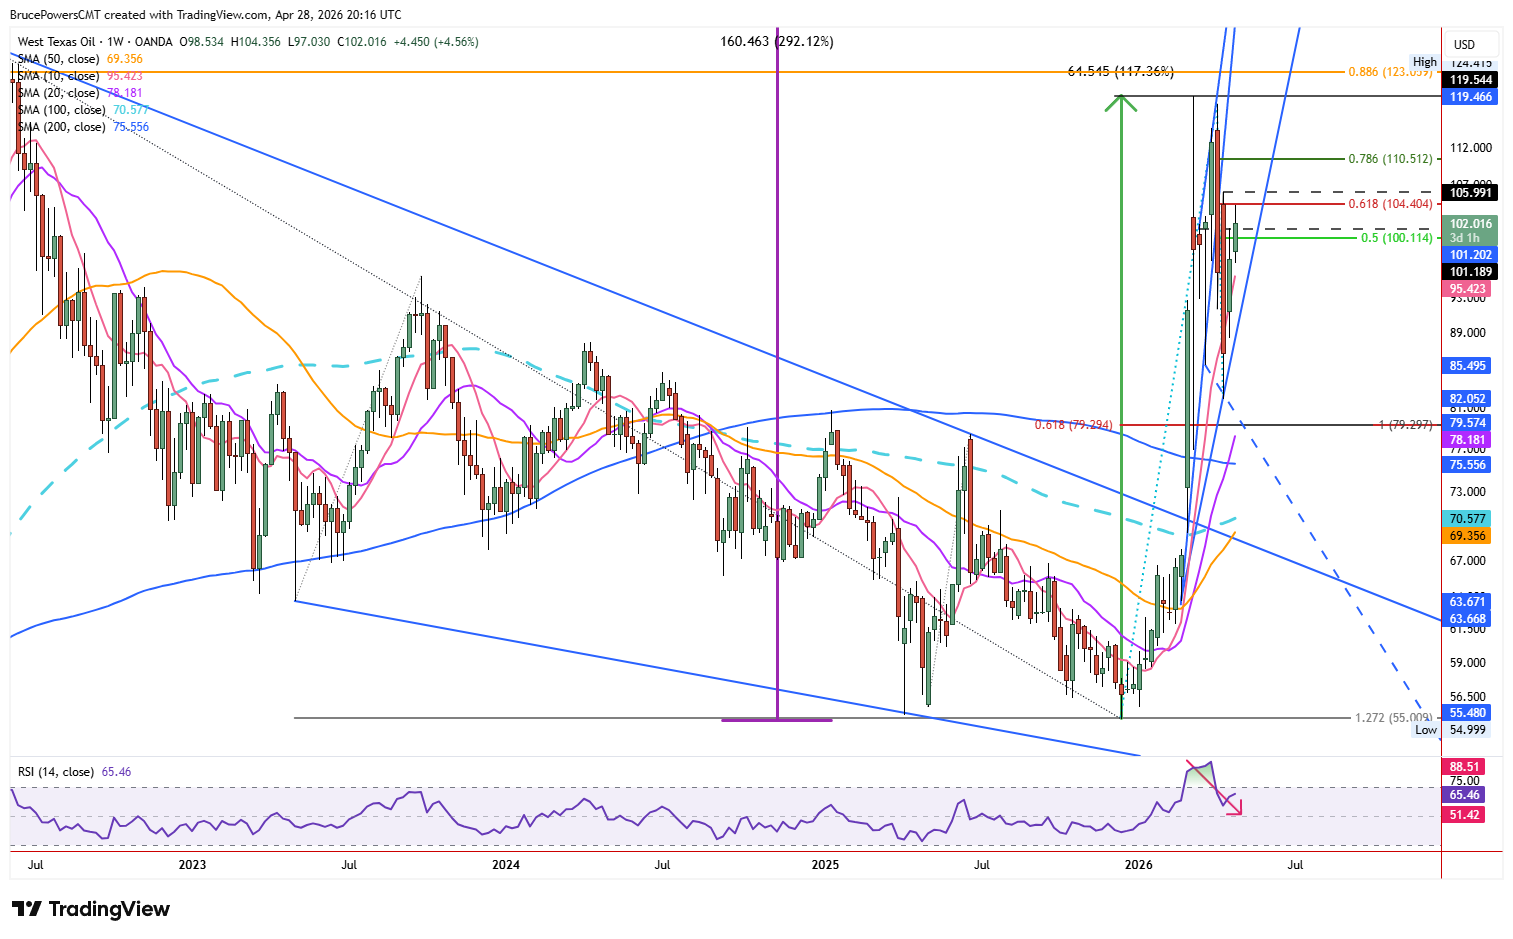
Near-term resistance is at Tuesday’s high and a rally above it points to the lower swing high at $105.99, while a recovery above that level will signal a bullish reversal of the recent decline. The next upside target above that swing high looks to be around the 78.6% Fibonacci retracement at $110.51. Given the recent elevation in volatility, it wouldn’t be surprising to see a continuation of the current upswing into that higher price zone, provided momentum continues to hold above near-term support levels.
Broader Support Structure and Trend Bias
Strong support was seen recently at $81.94, leading to the current advance. That was a successful test of support near the 50-day moving average and suggests that a low for the correction may have been established. It also points to that average as a key dynamic support indicator. If crude oil can remain above that average, it continues to have an upward bias. A sustained recovery of the 20-day moving average shows the short-term trend strengthening, supporting the potential for continuation if resistance levels are cleared.
Summary
From the breakout above key resistance and completion of the 61.8% retracement at the start of the move, crude oil continues to build a constructive technical structure, suggesting that the recent rally phase may extend further if support levels continue to hold and momentum remains intact.


