


Pullback to Key Support
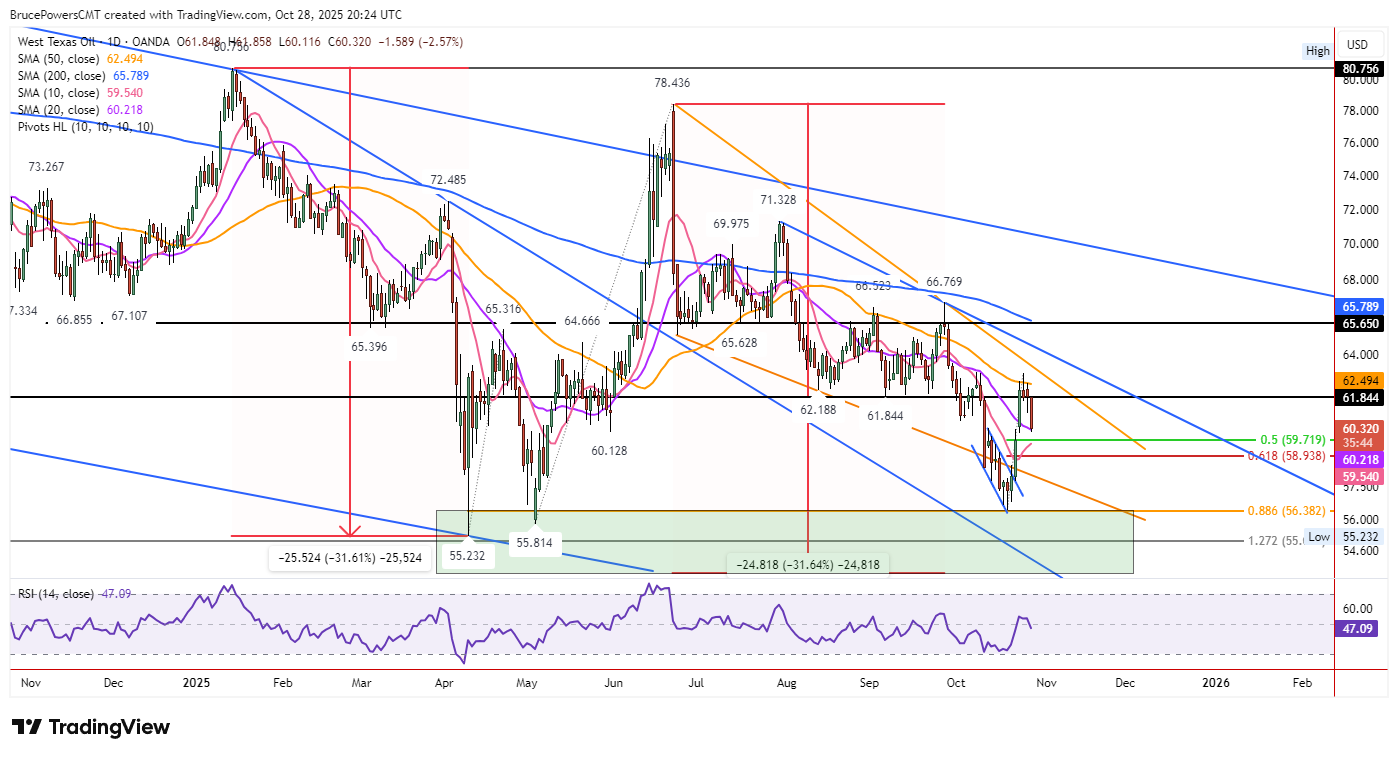
Crude oil slid to a low of $60.12 on Tuesday, testing the 20-day moving average as sellers held control. Trading lingers near the lows, with crude likely closing in the lower third of the $61.86-$60.12 daily range. This marks the second straight day of lower highs and lows since Friday’s $63.03 swing high, confirming support at the 20-day line ($60.23).
Resistance and Downtrend Pressure
Crude sits between 20-day support and the 50-day average at $62.50, still easing lower. A sustained drop below $60.12 would break the 20-day line, targeting the 10-day average at $59.55 and 50% retracement at $59.72. The 50-day’s rejection and Monday’s lower swing high keep the downtrend in play.
Correction Context
This is the first pullback after last week’s sharp bull breakout from a small falling consolidation channel. Such moves often see a second leg higher post-consolidation, aiming to clear the 50-day and $63.03. The 61.8% Fibonacci retracement at $58.94 marks deeper support if selling intensifies, with buyers needing to counter today’s bearish tone.
Upside Potential
If the 20-day holds, a breakout above $63.03 could target the 200-day average at $65.78. A prior support shelf at $61.84 may flip to resistance, aligning with a downtrend line. The breakout’s vigor suggests buyers could return once support solidifies.
Outlook
The $60.23 close is pivotal — below it opens $59.72, above it defends the uptrend. The 20-day test will reveal if bulls regroup or bears push to $58.94. Watch for $61.84 resistance on any bounce—$63.03 clearance fuels $65.78, but today’s weakness demands confirmation.
WTI Crude Oil Price Forecast
Every new WTI Crude Oil analysis as it publishes, today's technical signal and key levels, live price — on one page.
See all WTI Crude Oil forecastsFor a look at all of today’s economic events, check out our economic calendar.