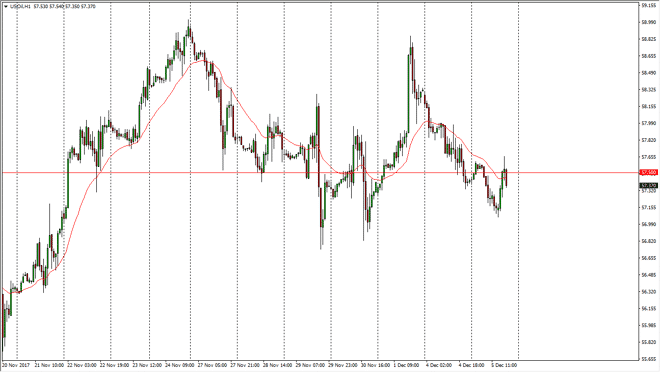
WTI Crude Oil The WTI Crude Oil market has initially fallen during the trading session on Tuesday, reaching towards the $57 level. That area has offered
The WTI Crude Oil market has initially fallen during the trading session on Tuesday, reaching towards the $57 level. That area has offered enough support underneath to reach towards the $58 level, but turned around to form a slightly exhaustive looking candle. We are now breaking down below the bottom of the candle and look likely to continue the bearish pressure. The $57 level offers plenty of support, and a breakdown below that level should send this market even lower. Given enough time, it’s likely that that we could break down below there, but we also could find plenty of buying pressure. And that’s the biggest problem with this market: we have OPEC looking to extend production cuts and announcing that it would until the end of next year, but at the same time every time we get the market rallying significantly, Americans will flood the market with supply. In other words, we are going to get a lot of volatility. A break above the top of the candle that peaked above the $58 level is a buying opportunity until we get to $58.80, but again, if we were to break down below the $57 level, we could drop to the $55 level. In other words, this market continues to be a mess.
Brent markets fell initially during the day, but then rallied significantly, only to turn around again. Given enough time, I believe that we will test the $62 level, which is a support of level that could mean a significant move lower. If we break down below the $62 level, we should then go to the $60 level after that. A break above the $62.90 level would then send this market towards the $64 level after that. Again, I believe that these markets are going to be very difficult to deal with.
Chris is a proprietary trader with more than 20 years of experience across various markets, including currencies, indices and commodities. As a senior analyst at FXEmpire since the website’s early days, he offers readers advanced market perspectives to navigate today’s financial landscape with confidence.