Key Insights:
- It was another bullish session for DOGE and SHIB on Wednesday.
- Dogecoin’s breakout stemmed from news of Bitcoin of America adding Dogecoin to its Bitcoin ATMs (BTMs).
- Key technical indicators are bullish, with DOGE and SHIB breaking out from their 200-day EMAs.
It was a bullish day for DOGE and SHIB on Wednesday. Bullish sentiment across the broader crypto market delivered support.
Following a 2.68% gain on Tuesday, DOGE rallied by 6.04% to end the day at $0.1299. SHIB followed a 2.18% gain from Tuesday, with a 3.96% rise to end the day at $0.00002439.
Crypto News Updates Deliver DOGE and SHIB Support
Broader investor appetite for cryptos delivered support to DOGE and SHIB mid-week.
News of more than 1.02bn SHIB tokens burnt on March 22 delivered SHIB support.
Dogecoin’s breakout stemmed from news of Bitcoin of America adding Dogecoin to its Bitcoin ATMs (BTMs). Increased access to Dogecoin is a key price driver, as is the case when exchanges include coins onto their platforms.
BTMs are not only cash dispensers but also support the buying of crypto with fiat and the selling of crypto for fiat.
DOGE Price Action
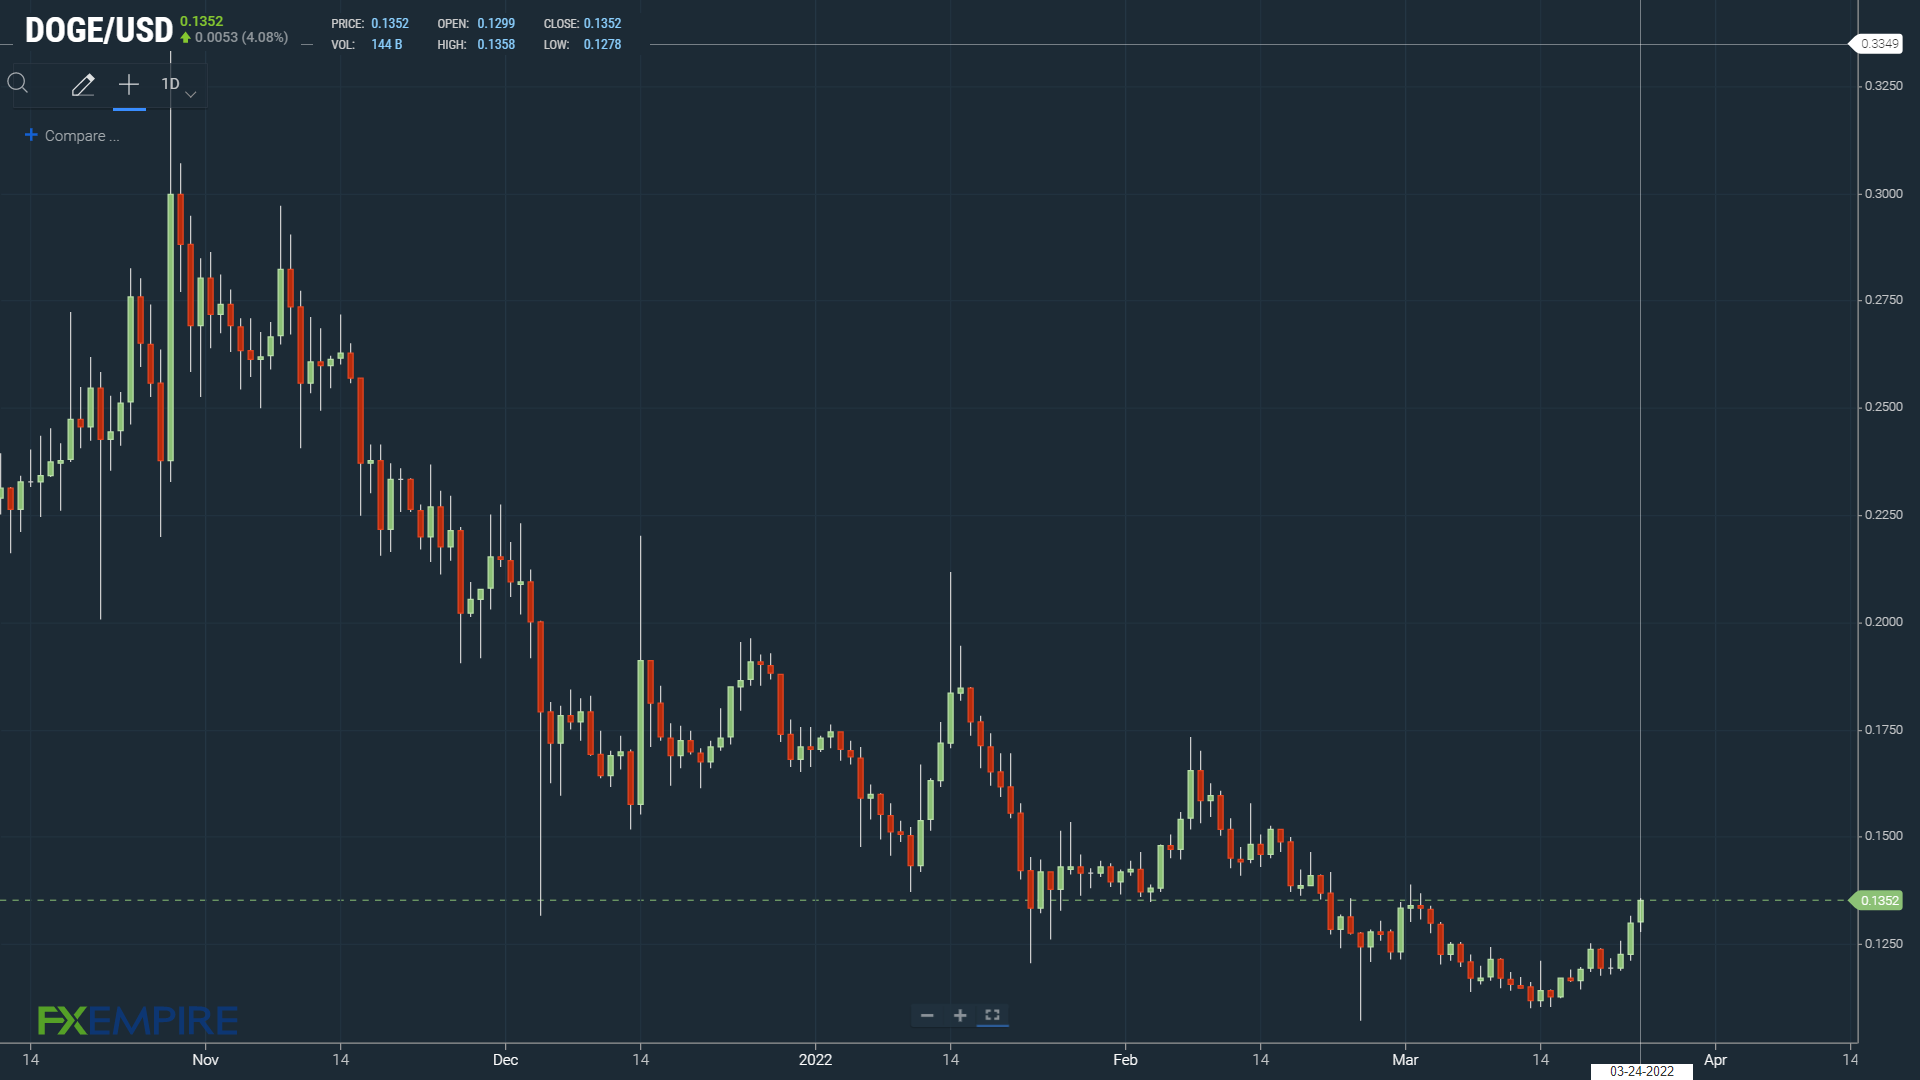
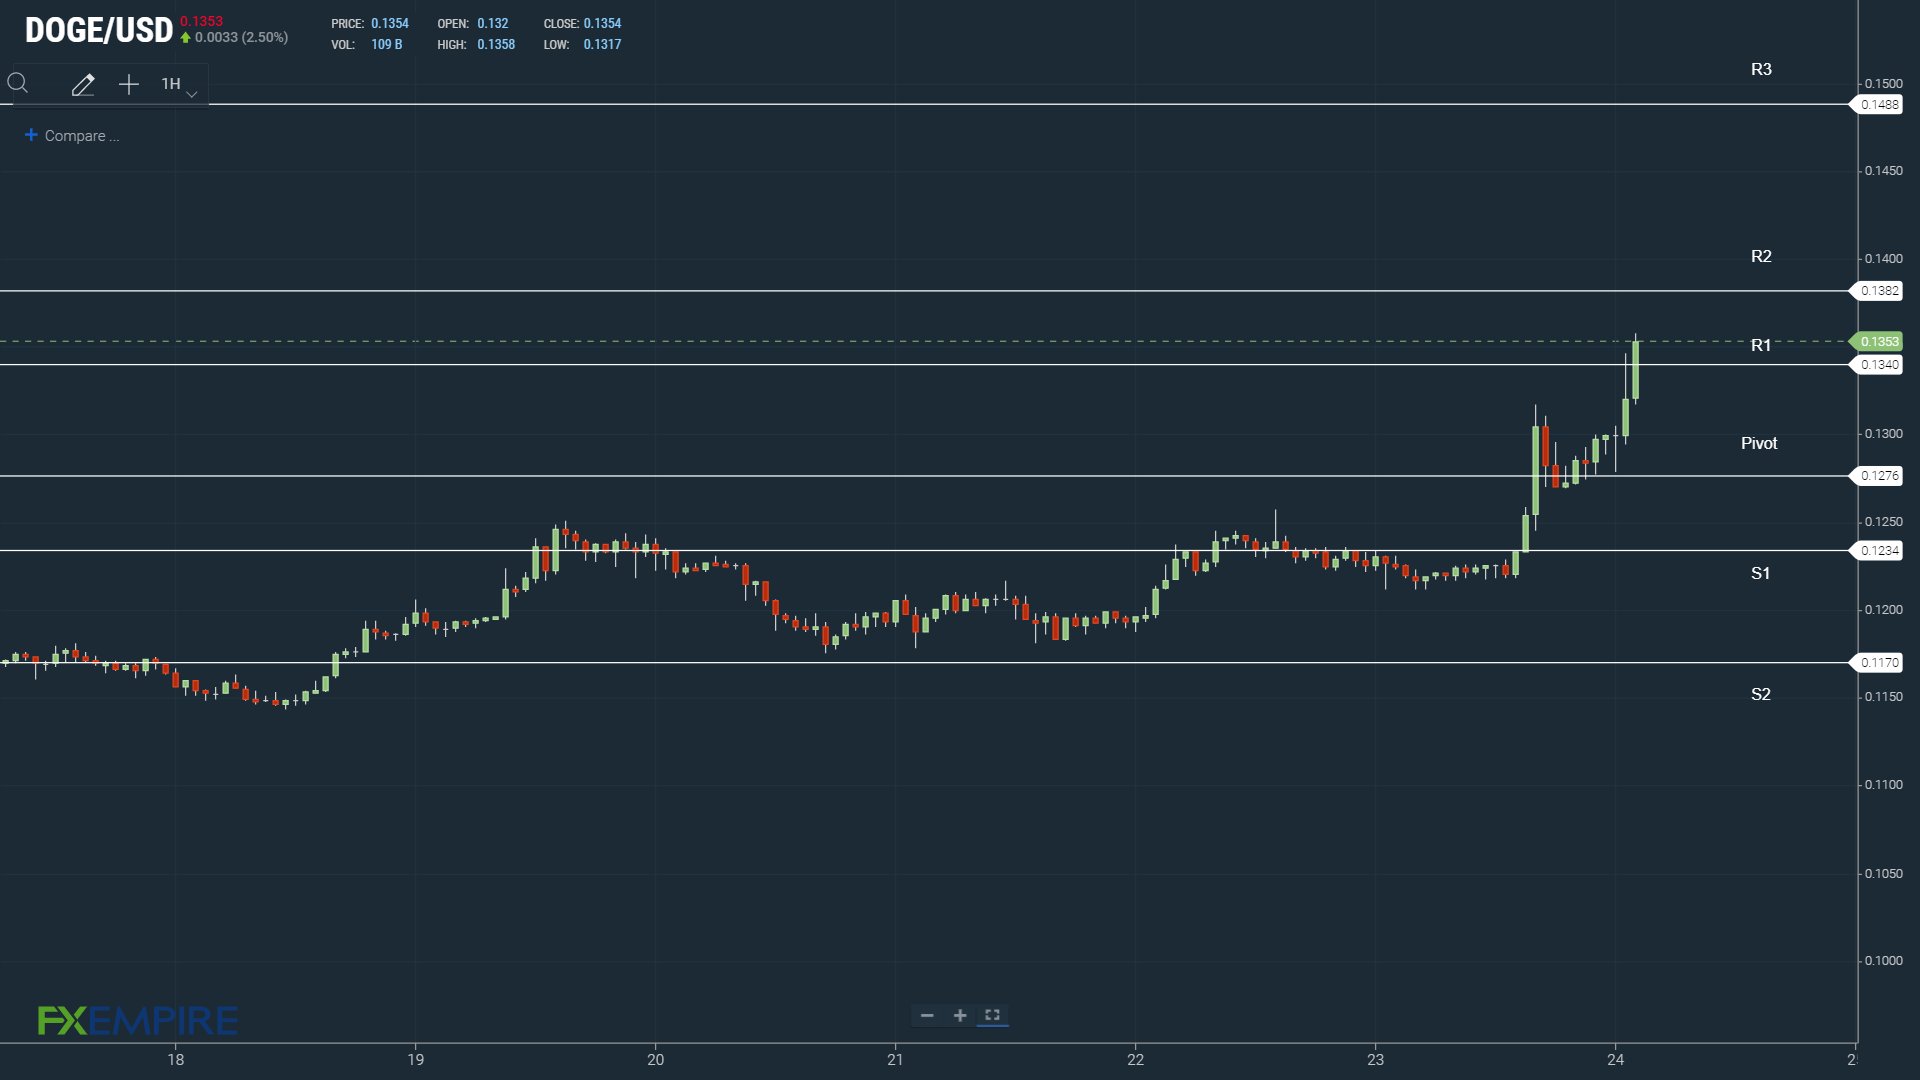
At the time of writing, DOGE was up 4.08% to $0.1352.
A bullish start to the day saw DOGE break through the First Major Resistance Level at $0.1340 to strike an early high of $0.1358.
Technical Indicators
DOGE will need to hold above the First Major Resistance Level at $0.1340 to take another run at the Second Major Resistance Level at $0.1382.
Support from the broader crypto market is needed for a move through the morning high of $0.1358.
An extended rally would test the resistance at $0.1400. The Third Major Resistance Level sits at $0.1488.
A fall through the First Major Resistance Level and the day’s $0.1276 pivot would test the First Major Support Level at $0.1234. Barring an extended sell-off, DOGE should steer clear of sub-$0.12. The Second Major Support Level sits at $0.1170.
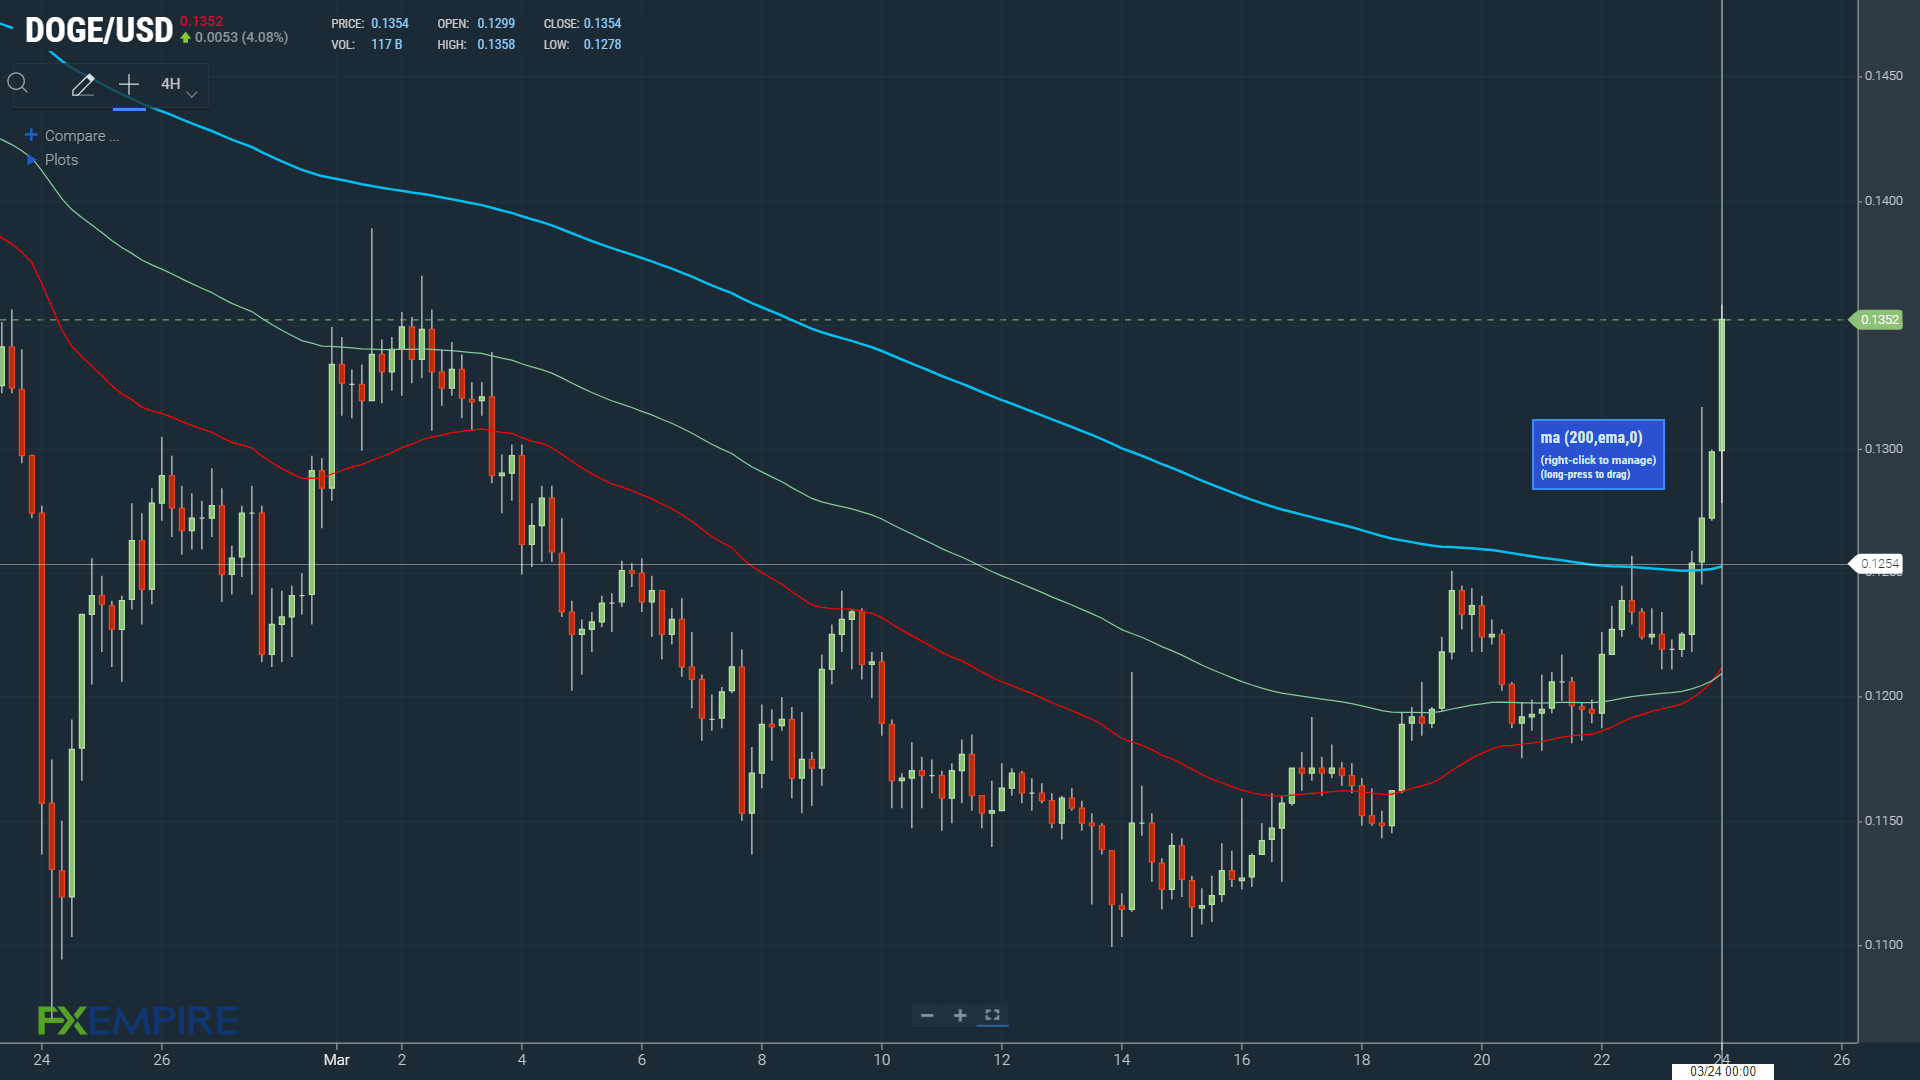
Looking at the EMAs and the 4-hourly candlestick chart (below), it is a bullish signal. DOGE sits above the 200-day EMA, currently at $0.1254.
This morning we had a bullish cross, with the 50-day EMA crossing through the 100-day. The 100-day EMA narrowed on the 200-day EMA, also positive.
Holding above the 200-day EMA would support a run at $0.14.
SHIB Price Action
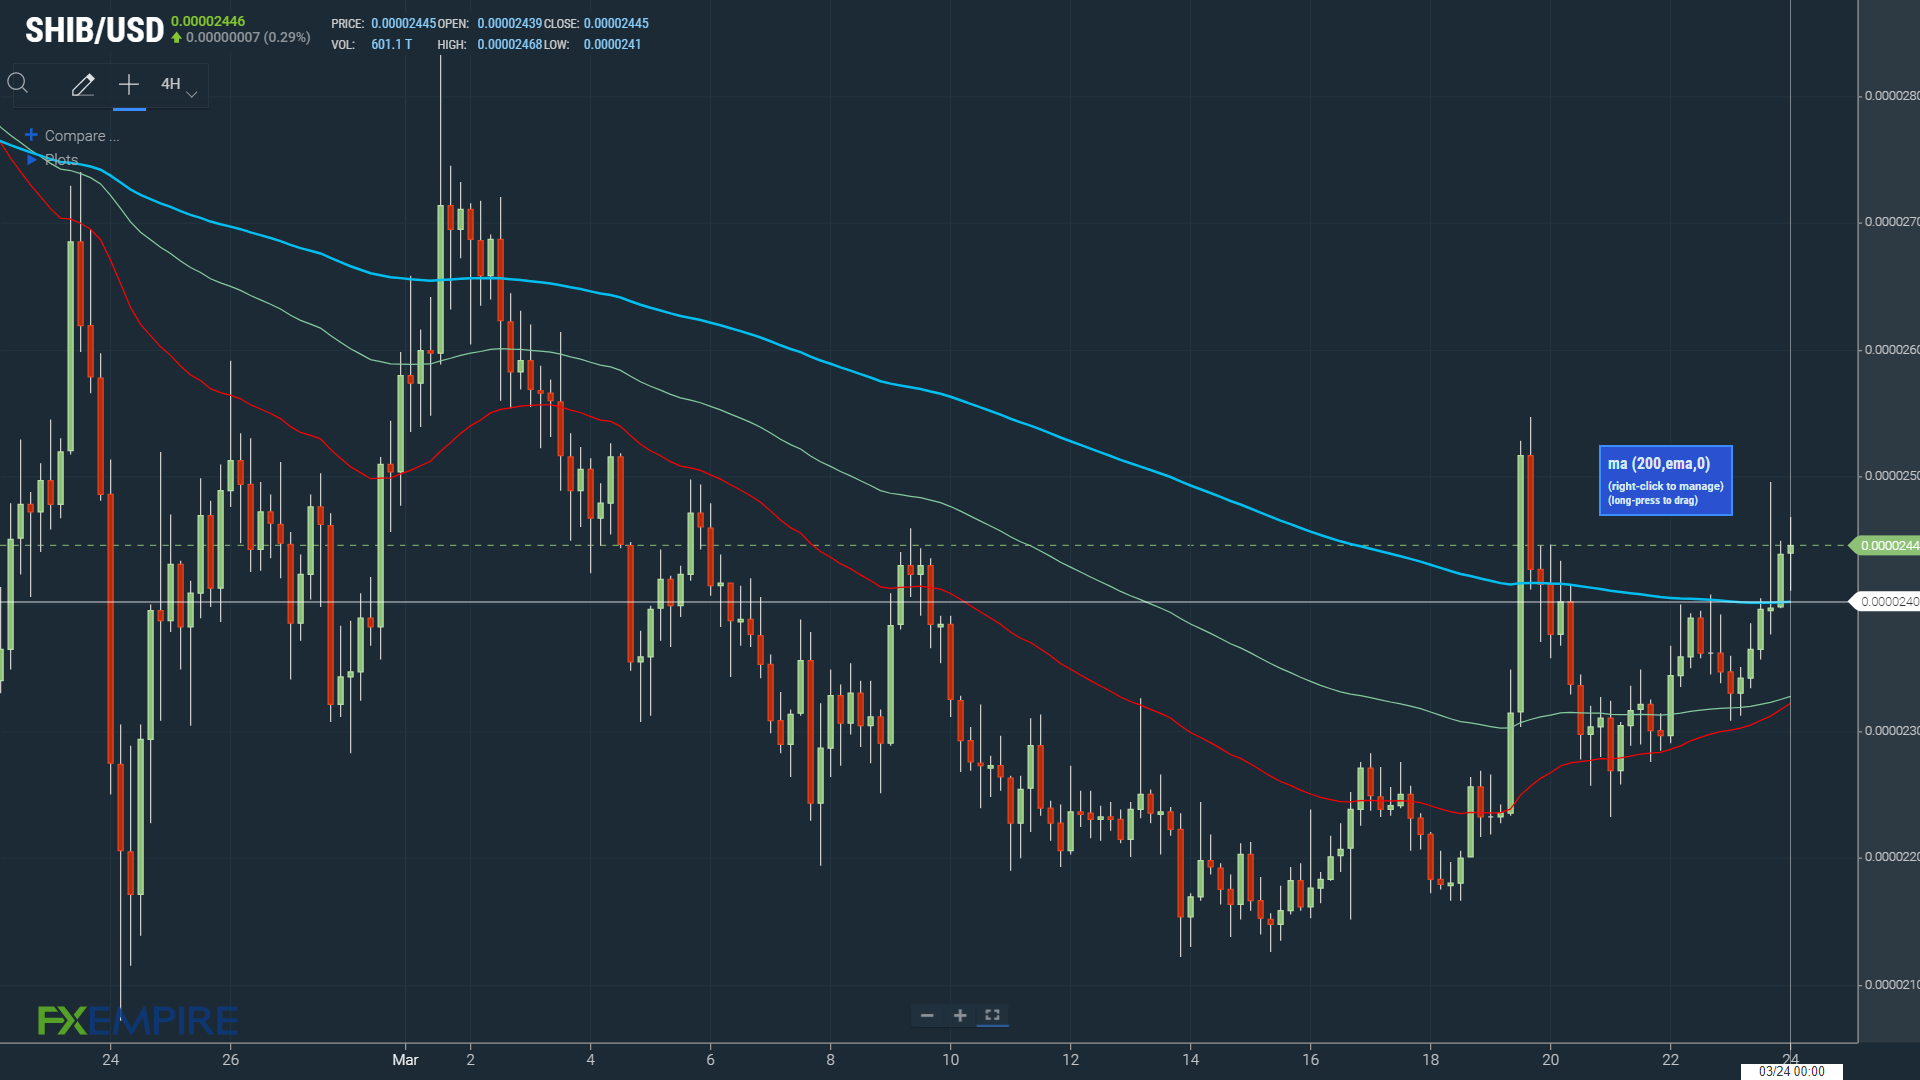
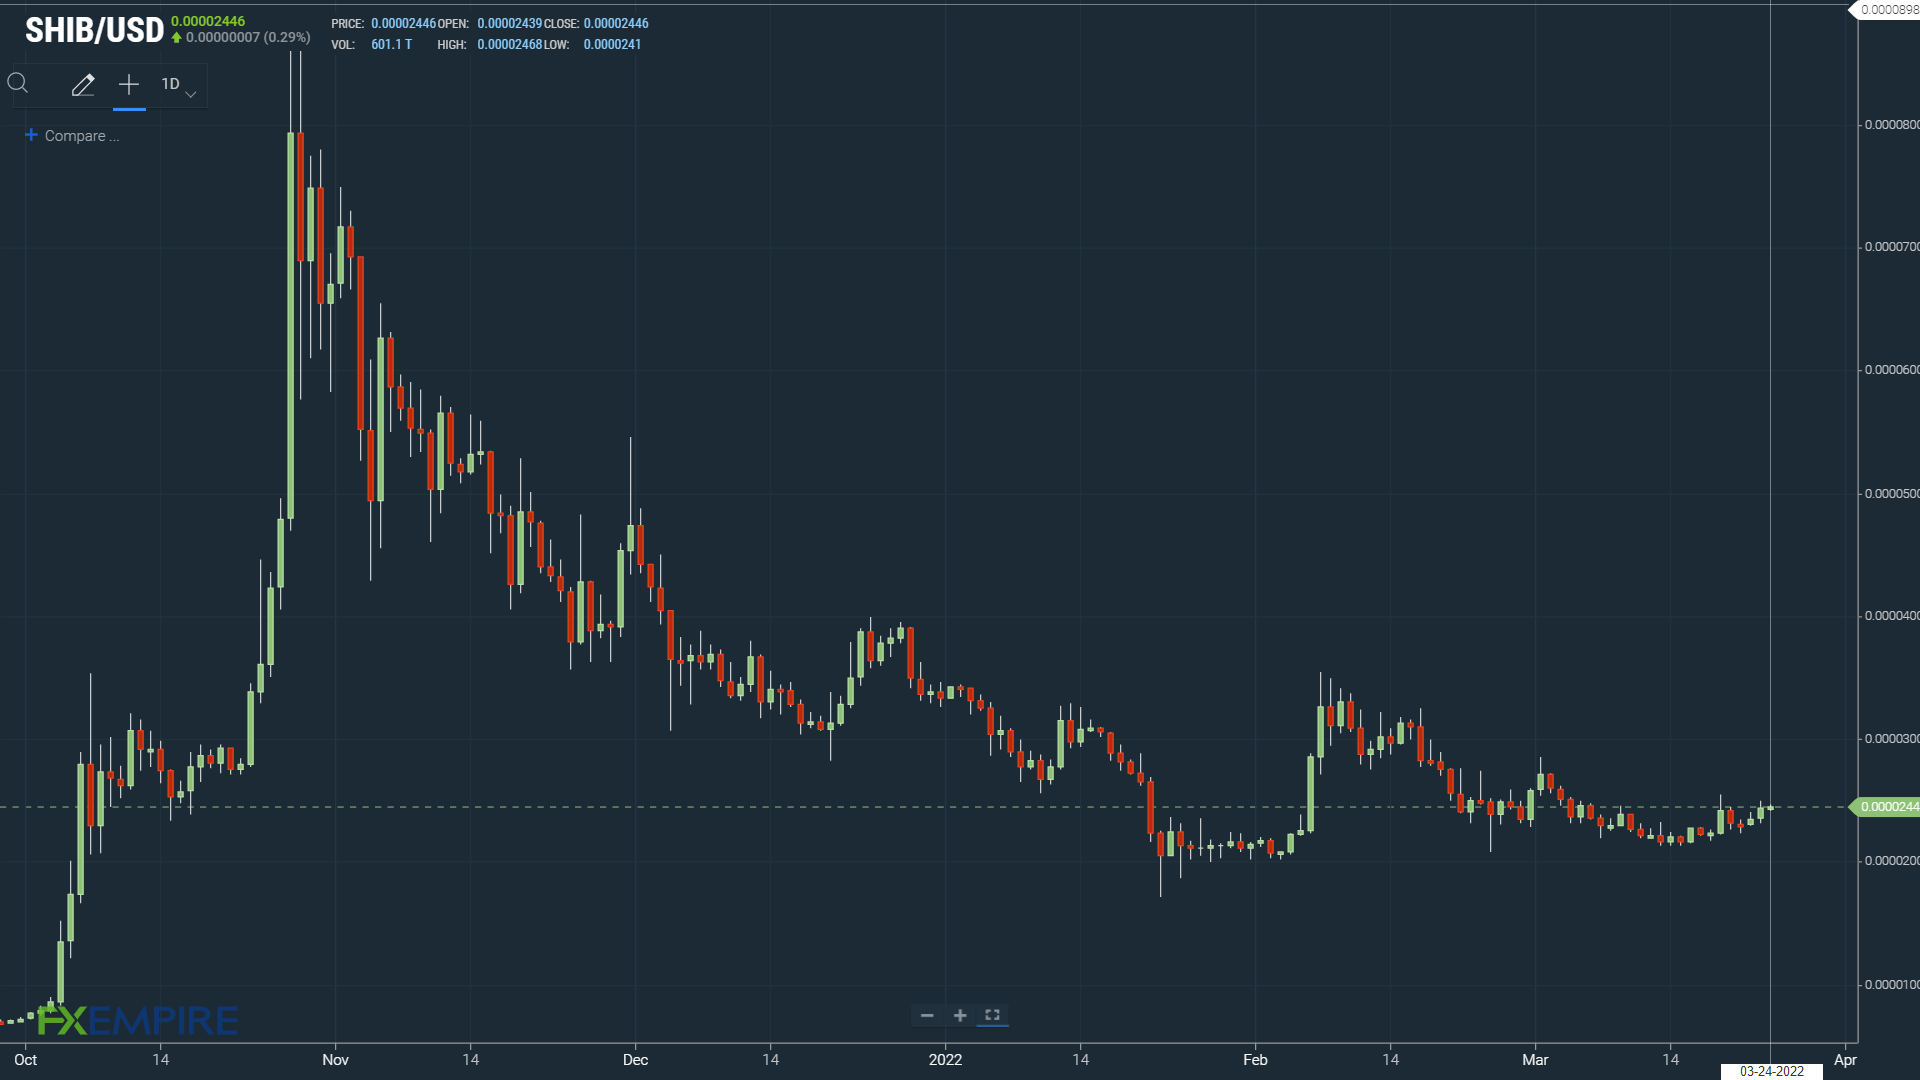
At the time of writing, SHIB was up by 0.29% to $0.00002446.
A mixed start to the day saw SHIB fall to an early low of $0.0000241 before striking a high of $0.00002468. Despite the early high, SHIB fell short of the day’s Major Resistance Levels.
Technical Indicators
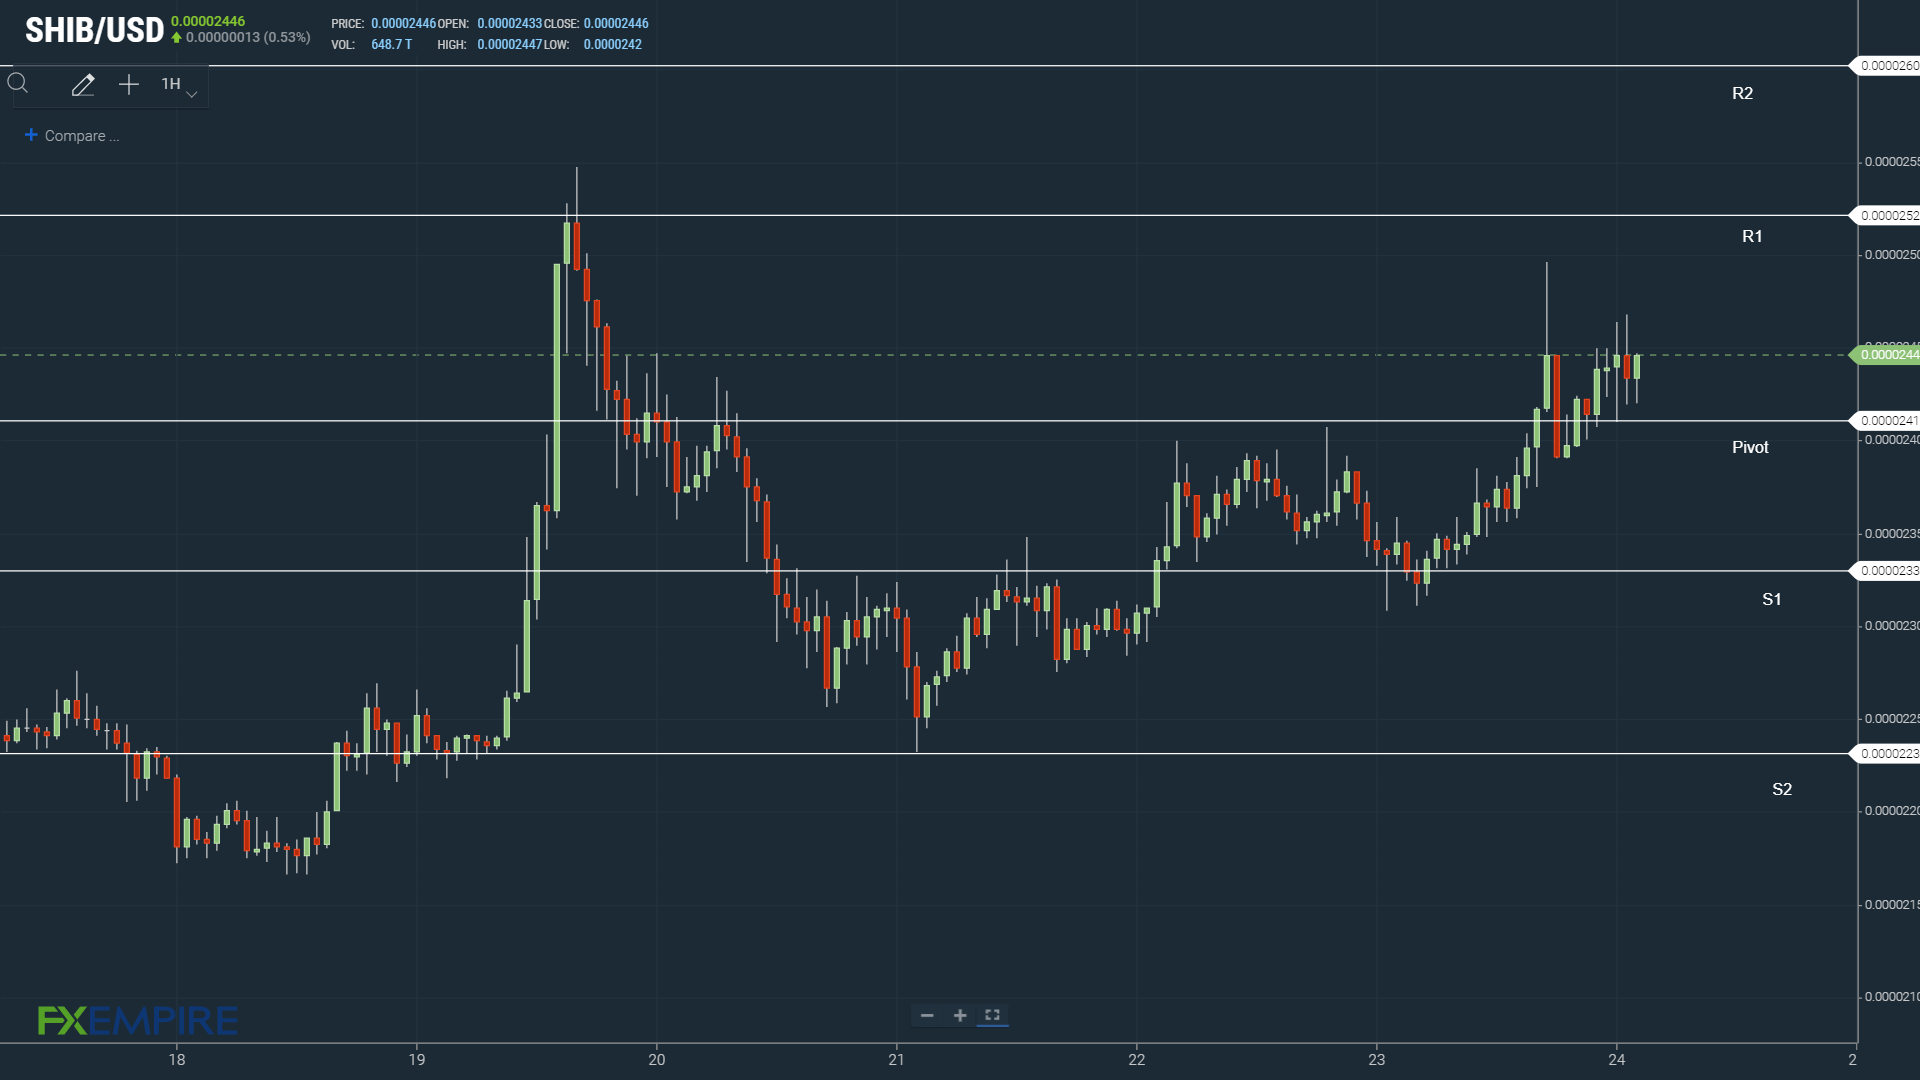
SHIB will need to avoid the day’s $0.0000241 pivot to make a run on the First Major Resistance Level at $0.0000252. SHIB would need the broader crypto market to move through Wednesday’s high of $0.00002496.
An extended rally would test the Second Major Resistance Level at $0.0000260. The Third Major Resistance Level sits at $0.0000279.
A fall through the pivot would bring the First Major Support Level at $0.0000233 into play. Barring an extended sell-off, SHIB should steer clear of sub-$0.000023 levels. The Second Major Support Level sits at $0.0000223.
Looking at the EMAs and the 4-hourly candlestick chart (below), it is a bullish signal. SHIB sits above the 200-day EMA at $0.0000240. This morning, the 50-day EMA converged on the 100-day EMA. The 100-day EMA narrowed to the 200-day EMA, also positive.
A bullish cross of the 50-day EMA through the 100-day EMA would bring $0.000026 levels into play.