
Advertisement
Advertisement
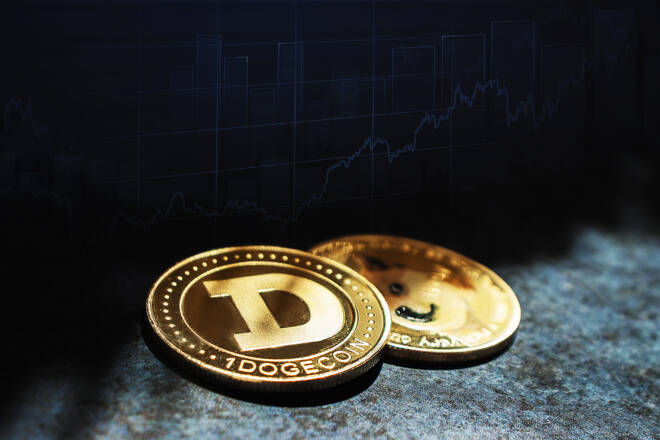
DOGE Risks a Return to Sub-$0.0700 on Twitter News and FTX Contagion
By:
Following Monday's pullback, DOGE and SHIB found early support this morning. However, FTX contagion leaves both exposed to the risk of further losses.
Key Insights:
- Dogecoin (DOGE) and shiba inu coin (SHIB) saw red for a second consecutive session on Monday.
- FTX contagion risk spread on news of Genesis warning of a bankruptcy threat, with Twitter updates also weighing.
- The technical indicators remain bearish, with the EMAs signaling further downside.
On Monday, dogecoin (DOGE) fell by 2.99%. Following a 9.10% slide on Sunday, DOGE ended the day at $0.0746. Notably, DOGE ended the day at sub-$0.0800 for the second time since November 9.
A choppy start to the day saw DOGE rise to a mid-morning high of $0.0772. Falling short of the First Major Resistance Level (R1) at $0.0829, DOGE slid to a late low of $0.0713. DOGE briefly fell through the First Major Support Level (S1) at $0.0736 before ending the day at $0.0746.
Shiba inu coin (SHIB) slid by 4.21% on Monday. Following a 3.83% loss on Sunday, SHIB ended the day at $0.00000841.
SHIB rose to an early morning high of $0.00000879. Coming up short of the First Major Resistance Level (R1) at $0.00000911, SHIB slid to a late low of $0.00000822. SHIB fell through the First Major Support Level (S1) at $0.00000855 and briefly through the Second Major Support Level (S2) at $0.00000833 before ending the day at sub-$0.00000841.
FTX contagion risk continued to weigh on investor sentiment. Following news of Genesis freezing withdrawals, news of Genesis delivering a bankruptcy warning sent DOGE and SHIB into the red.
No immediate signs of Twitter resumping the crypto integration program was also DOGE negative.
This morning, DOGE and SHIB found early support. However, barring DOGE-friendly Twitter and Elon Musk announcements, FTX contagion will threaten further losses.
Dogecoin (DOGE) Price Action
At the time of writing, DOGE was up 1.74% to $0.0759. A bullish start to the day saw DOGE rise from an early low of $0.0744 to a high of $0.0762.
Technical Indicators
DOGE needs to avoid the $0.0744 pivot to target the First Major Resistance Level (R1) at $0.0774. A move through the Monday high of $0.0772 would signal a bullish afternoon session. However, the crypto news wires need to be crypto-friendly to support a breakout session.
In the event of an extended afternoon breakout session, the bulls could take a run at the Second Major Resistance Level (R2) at $0.0803. The Third Major Resistance Level (R3) sits at $0.0862.
A fall through the pivot ($0.0744) would bring the First Major Support Level (S1) at $0.0715 into play. However, barring another extended sell-off, DOGE should avoid sub-$0.0700 and the Second Major Support Level (S2) at $0.0685. Further signs of FTX contagion would bring sub-$0.0700 into view.
The Third Major Support Level (S3) sits at $0.0626.
The EMAs sent a bearish signal, with DOGE sitting below the 50-day EMA, currently at $0.0835. The 50-day EMA slid back from the 200-day EMA, with the 100-day EMA converging on the 200-day EMA. The price signals were bearish.
A move through R1 ($0.0773) would give the bulls a run at R2 ($0.0803) and the 50-day EMA ($0.0835). However, failure to move through the 50-day EMA would leave DOGE under pressure. A bearish cross of the 100-day EMA through the 200-day EMA would give the bears a run at sub-$0.0700.
Shiba Inu Coin (SHIB) Price Action
At the time of writing, SHIB was up 0.71% to $0.00000847. A bullish start to the day saw SHIB rise from an early low of $0.00000839 to a high of $0.00000854.
Technical Indicators
SHIB needs to avoid a fall through the $0.00000847 pivot to target the First Major Resistance Level (R1) at $0.00000873 and the Monday high of $0.00000879. A return to $0.00000870 would signal a bullish afternoon session. However, any further contagion news would test buyer appetite.
In the case of an extended rally, SHIB would likely test the Second Major Resistance Level (R2) at $0.00000904. The Third Major Resistance Level (R3) sits at $0.00000961.
A fall through the pivot would bring the First Major Support Level (S1) at $0.00000816 into play. Barring another extended sell-off, SHIB should avoid sub-$0.00000800 and the Second Major Support Level (S2) at $0.00000790.
The Third Major Support Level (S3) sits at $0.00000733.
The EMAs send a bearish signal, with SHIB sitting below the 50-day EMA, currently at $0.00000912. This morning, the 50-day EMA fell back from the 100-day EMA, with the 100-day EMA easing back from the 200-day EMA. The signals were bearish.
A move through R1 ($0.00000873) would give the bulls a run at R2 ($0.00000904) and the 50-day EMA ($0.00000912). However, failure to move through the 50-day EMA would leave SHIB under pressure.
About the Author
Bob Masonauthor
With over 28 years of experience in the financial industry, Bob has worked with various global rating agencies and multinational banks. Currently he is covering currencies, commodities, alternative asset classes and global equities, focusing mostly on European and Asian markets.


Advertisement