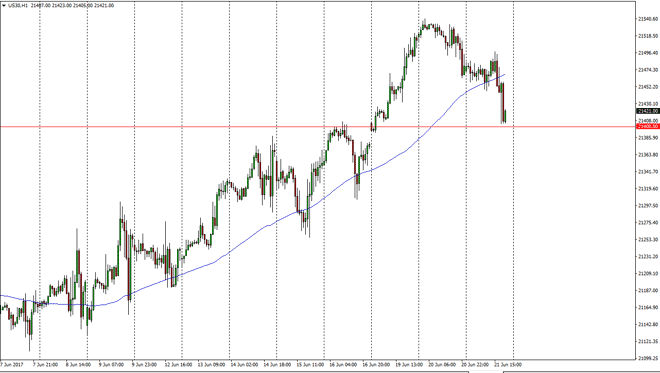
Dow Jones 30 The Dow Jones 30 went sideways initially during the day on Wednesday, but then broke down significantly, reaching towards the gap that had
The Dow Jones 30 went sideways initially during the day on Wednesday, but then broke down significantly, reaching towards the gap that had formed several sessions ago. The 21,400-level offered enough bullish pressure to turn things around and perhaps send this market higher and keep the longer-term uptrend going higher. I believe that the market continues to be one that you can buy on dips, and the gap at the 21,400 region should be massively supportive. If we can bounce from here, I think the market should then go to the 21,500 level again. I believe that the short-term pullbacks continue to offer buying opportunities, least until we can break down below the 21,300 level. I don’t have any interest in shorting this market, the blue-chip index continues to be one that money flows two, as there are a lot of concerns and of course sector rotation out of the NASDAQ 100.
The NASDAQ 100 had an explosive move to the upside, as money starts flowing into biotech stocks. If we can break above the 5775 level, the market should then go to the 5875-level next, and then eventually the 5900 level. If we can break above their, the market should continue to go towards the 6000 level which is my longer-term target. I believe that 5700 level underneath will continue to be the floor, so I think it’s only matter of time before the buyers get involved on short-term pullbacks. I have no interest in selling the NASDAQ 100, nor do I have any interest in selling the stock markets. The market looks ready to break out, and on that move, I expect the market to be rather explosive in the short run.
Chris is a proprietary trader with more than 20 years of experience across various markets, including currencies, indices and commodities. As a senior analyst at FXEmpire since the website’s early days, he offers readers advanced market perspectives to navigate today’s financial landscape with confidence.