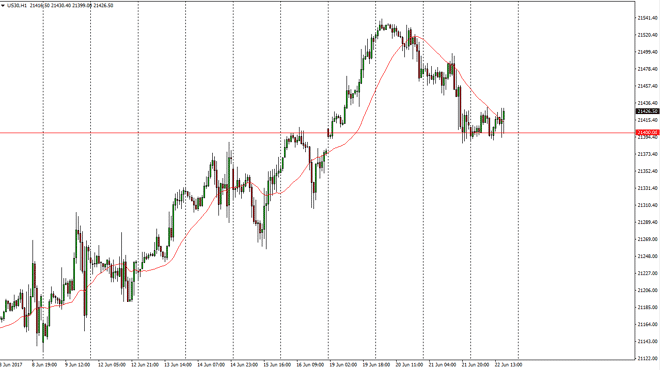
Dow Jones 30 The Dow Jones 30 went sideways overall during the session on Thursday, as we continue to see plenty of support at the 21,400 level.
The Dow Jones 30 went sideways overall during the session on Thursday, as we continue to see plenty of support at the 21,400 level. Ultimately, the market should continue to find buyers in that area, and with this being the case I think that eventually we will break out to the upside. Ultimately, the market should continue to do well longer-term, and I believe that we are essentially in an accumulation phase, which can last for a while. However, I believe that we will eventually go to the 21,500 level which was the recent highs. A break above there continues a longer-term “buy-and-hold” aspect of this market. Ultimately, I have no interest in selling and the gap that is just below current levels should continue to attract a lot of support.
The NASDAQ 100 initially tried to rally during the day on Thursday, breaking above the 5800 level, but then dropped below to find support at the 5775 handle. This is an area that was previously resistive, so it should now be supportive. A break above the 5800 level again should send this market looking for the 5900 level, as the market has been in a longer-term uptrend, and the recent selloff had more to do with a handful of stocks and sector rotation than anything else. We have biotech exploding to the upside in the United States, and that of course helps the NASDAQ 100 as well. A break above the 5900 level is my longer-term goal, but it may take several weeks to have that happen. Once it does, I believe that we continue to go towards the 6000 handle. As far selling is concerned, I have no interest in doing so, as I believe that the buyers are starting to take over yet again.
Chris is a proprietary trader with more than 20 years of experience across various markets, including currencies, indices and commodities. As a senior analyst at FXEmpire since the website’s early days, he offers readers advanced market perspectives to navigate today’s financial landscape with confidence.