
Advertisement
Advertisement
Dow Jones 30 and NASDAQ 100 Forecast March 22, 2017, Technical Analysis
Updated: Mar 22, 2017, 04:36 GMT+00:00
Dow Jones 30 The Dow Jones 30 initially tried to rally on Tuesday, but found enough resistance above to turn the market around. By forming this negative
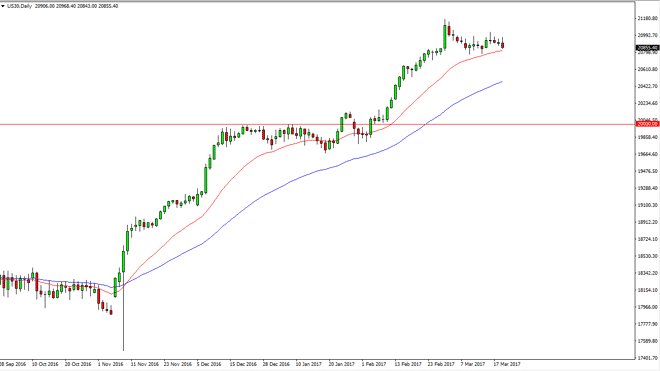
Dow Jones 30
The Dow Jones 30 initially tried to rally on Tuesday, but found enough resistance above to turn the market around. By forming this negative candle, we are testing the 50-day exponential moving average. I believe that this market will continue to be very bullish, so a supportive candle or a bounce has me going long. I have no interest in shorting this market anytime soon.
Dow Jones 30 and NASDAQ Index Video 22.3.17
NASDAQ 100
The NASDAQ 100 initially tried to rally during the day on Tuesday, but found enough resistance near the 5440 level to turn things around. I think the given enough time we should see the 20-day exponential moving average, pictured in green, offer dynamic support yet again. I believe that the NASDAQ 100 should reach towards the 5500 level over the longer term.
About the Author
Christopher Lewisauthor
Chris is a proprietary trader with more than 20 years of experience across various markets, including currencies, indices and commodities. As a senior analyst at FXEmpire since the website’s early days, he offers readers advanced market perspectives to navigate today’s financial landscape with confidence.


Advertisement