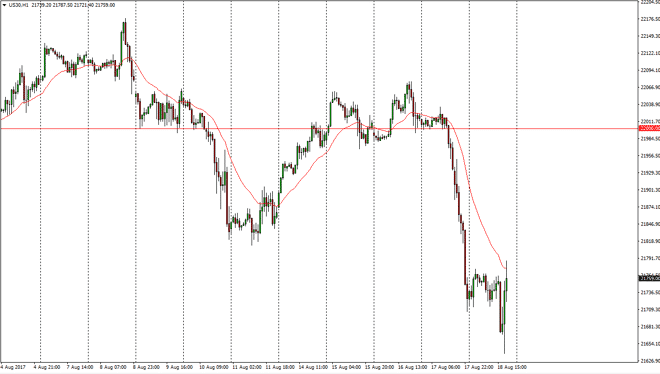
Dow Jones 30 The Dow Jones 30 initially fell on Friday, but the Americans turn things around as we look likely to try to bounce from here. The 22,000
The Dow Jones 30 initially fell on Friday, but the Americans turn things around as we look likely to try to bounce from here. The 22,000 level above should be resistance, so I don’t think that we will break above there right away. However, it does give a target for the buyers who are starting to flex their muscles. With this being the case, I think that short-term buying has reentered the marketplace.
The NASDAQ 100 initially fell as well, but has shown real fiber and see during the day on Friday, as we made a fresh new low and then turned around to show signs of strength again. The NASDAQ 100 has been leading the other indices higher, so it’s likely that we will continue to go to the upside and reach towards the 5900 level. I believe that short-term pullbacks continue to offer value the traders will take advantage of, but if we made a fresh, new low I would step away from the market and let it try to catch its self.
Chris is a proprietary trader with more than 20 years of experience across various markets, including currencies, indices and commodities. As a senior analyst at FXEmpire since the website’s early days, he offers readers advanced market perspectives to navigate today’s financial landscape with confidence.