Based on the early price action, the direction of the June E-mini Dow Jones Industrial Average on Wednesday will be determined by trader reaction to the Gann angle at 26273.
June E-mini Dow Jones Industrial Average futures are trading higher early Wednesday amid a report that says the U.S. and China are close to announcing a deal to end the more-than-year-long trade dispute. The announcement could spike prices higher, but since most of the news has already been price into the market, traders should watch for a potentially bearish closing price reversal top.
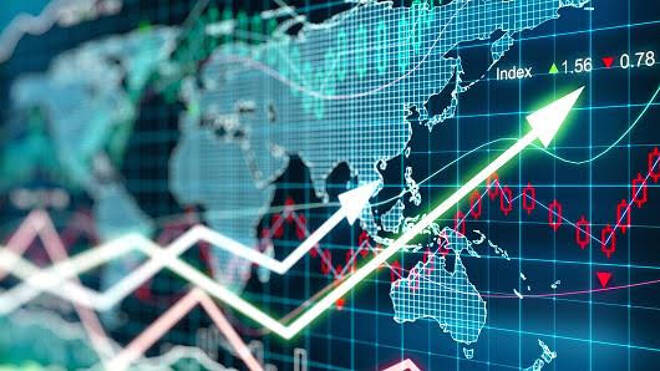
At 06:56 GMT, June E-mini Dow Jones Industrial Average futures are trading 26256, up 103 or +0.39%.
The main trend is up according to the daily swing chart. A trade through 26288 will reaffirm the uptrend. The swing chart shows there are no main tops until 26988 so we could see a strong breakout to the upside before traders encounter resistance.
The main trend will change to down on a trade through 25377. However, don’t worry about a change in trend. Instead keep your eye out for a closing price reversal top. Although this chart pattern won’t change the main trend to down, it could signal that the selling is greater than the buying at current price levels. This could trigger a 2 to 3 day retracement of the last rally.
Based on the early price action, the direction of the June E-mini Dow Jones Industrial Average on Wednesday will be determined by trader reaction to the Gann angle at 26273.
A sustained move over 26273 will indicate the presence of buyers. This could create the momentum needed to trigger an acceleration over 26288.
The inability to overcome 26273 will signal the presence of sellers. If this comes in strong enough then look for selling pressure to build. The nearest support angle comes in at 25825.
James Hyerczyk is a U.S. based seasoned technical analyst and educator with over 40 years of experience in market analysis and trading, specializing in chart patterns and price movement. He is the author of two books on technical analysis and has a background in both futures and stock markets.