
Advertisement
Advertisement
E-mini Dow Jones Industrial Average (YM) Futures Analysis – October 3, 2014 Forecast
By:
Although the December E-mini Dow Jones industrial Average finished lower, the price action suggests it made a successful test of a major retracement zone.
Although the December E-mini Dow Jones industrial Average finished lower, the price action suggests it made a successful test of a major retracement zone. The close near the high suggests a slight upside bias. A follow-through rally today could generate enough upside momentum to trigger a rally into the retracement zone created by the last sell-off.
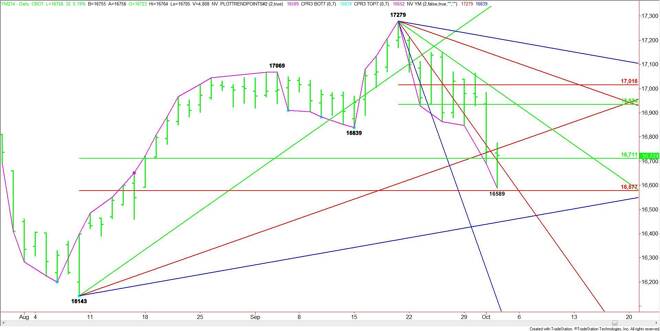
The main range is 16143 to 17279. The retracement zone created by this range at 16711 to 16577 stopped the break on Thursday. The low at 16589 was slightly above the lower or Fibonacci level at 16577. The rebound from this low was strong enough to overtake the upper or 50% level at 16711. The two levels at 16711 and 16577 are new support today.
Crossing to the strong side of a downtrending angle at 16639 is also giving the market an upside bias. But overtaking the uptrending angle at 16767 could be the trigger point for an acceleration to the upside since the daily chart is indicating there is plenty of room to run.
The short-term range is 17279 to 16589. This makes its retracement zone at 16834 to 17016 the next likely upside target. A downtrending angle from the 17279 top passes through this zone today at 16959, making it a valid target also.
A failure to follow-through to the upside will be a sign of selling pressure. Crossing to the weak side of the downtrending angle at 16639 will indicate the selling is intensifying. Taking out the Fibonacci level at 16577 could trigger an acceleration to the downside with 16455 the next likely target.
16711 is likely to act like a pivot today. Overtaking 16767 will give the market a bullish bias while a sustained move under 16639 will be bearish.
About the Author
James Hyerczykauthor
James Hyerczyk is a U.S. based seasoned technical analyst and educator with over 40 years of experience in market analysis and trading, specializing in chart patterns and price movement. He is the author of two books on technical analysis and has a background in both futures and stock markets.


Advertisement