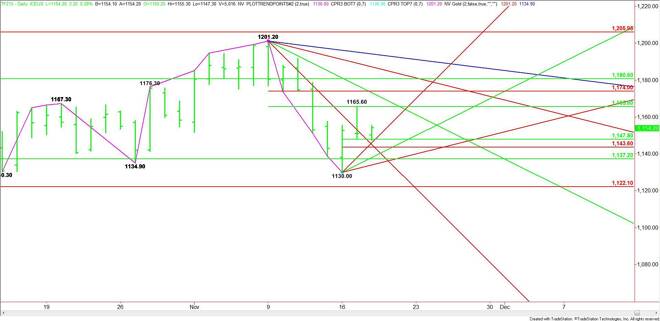
December E-mini Russell 2000 index futures are called better shortly before the cash market opening. The index completed a 50% retracement of the week’s
December E-mini Russell 2000 index futures are called better shortly before the cash market opening. The index completed a 50% retracement of the week’s range early in the session.
The main trend is down according to the daily swing chart.
The main retracement zone is 1137.20 to 1122.10. This zone provided support earlier in the week when the market made a closing price reversal bottom at 1130.00.
The intermediate range is 1201.20 to 1130.00. Its retracement zone is 1165.60 to 1174.00. This zone stopped the rally on Tuesday when the market reached a high of 1165.60.
The short-term range is 1130.00 to 1165.60. Its retracement zone at 1147.80 to 1143.60 provided support earlier in the session when the index rebounded from a trade to 1147.30.
Based on yesterday’s close at 1151.00, the direction of the market is likely to be determined by trader reaction to the short-term 50% level at 1147.80.
A sustained move over 1147.80 signals the presence of buyers. The daily chart indicates there is room to the upside with the next target 1165.60. This is also a trigger point for a possible acceleration into a downtrending angle at 1173.20 and a Fibonacci level at 1174.00.
A sustained move under 1147.80 will indicate the presence of sellers, however, the selling may be labored because of potential support at 1146.00 and 1143.60.
The daily chart will open up to the downside if 1143.60 is taken out with conviction. This is followed by an uptrending angle at 1138.00, a Fibonacci level at 1137.20 and another angle at 1134.00. The latter is the last potential support angle before the 1130.00 main bottom.
Watch the price action and read the order flow at 1147.80 today. Trader reaction to this level will tell us whether the bulls or the bears are in control.
James Hyerczyk is a U.S. based seasoned technical analyst and educator with over 40 years of experience in market analysis and trading, specializing in chart patterns and price movement. He is the author of two books on technical analysis and has a background in both futures and stock markets.