
Advertisement
Advertisement
E-mini S&P 500 Index (ES) Futures Technical Analysis – November 10, 2015 Forecast
By:
December E-mini S&P 500 Index futures finished sharply lower on Monday as investors pared positions on worries of higher U.S. interest rates and a
December E-mini S&P 500 Index futures finished sharply lower on Monday as investors pared positions on worries of higher U.S. interest rates and a slowdown in the global economy.
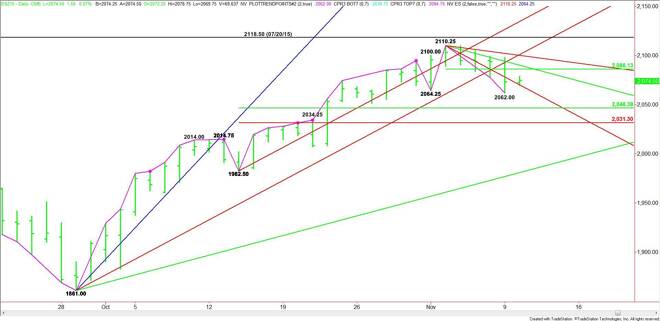
The main trend turned down on Monday according to the daily swing chart when the index traded through the November 2 main bottom at 2064.25. The selling stopped at 2062.00. There was no follow-through to the downside which suggests the break between 2064.25 and 2062.00 was triggered by sell-stops rather than aggressive shorting.
The inability to follow-through to the downside also suggests there may be one more rally. It will likely be a retracement of the first break from the recent top.
The first leg down from 2110.25 to 2062.00 makes 2086.25 a key 50% level or pivot price. This level is the first potential upside target. Trader reaction to this level will likely determine the tone of the market today or perhaps the direction of the market over the near-term.
Based on yesterday’s close at 2073.00, the first price to watch is a steep downtrending angle at 2070.25.
A sustained move over 2070.25 will signal the presence of buyers. This could create enough upside momentum to test the short-term 50% level at 2086.25. This is followed closely by a downtrending angle at 2090.25.
The index opens up to the upside over 2090.25 with the next a potential resistance cluster at 2100.25 to 2101.00.
A sustained move under 2073.00 will indicate the presence of sellers. The first target is yesterday’s low at 2062.00. Taking out this level will signal a resumption of the downtrend.
If the selling pressure continues then the primary downside target becomes the 2046.25 to 2031.25 retracement zone.
Early in the session, watch the price action and order flow at 2070.25 for signs or buying or selling. If there is a rally then the next important level to watch for buying or selling is the pivot at 2086.25.
About the Author
James Hyerczykauthor
James Hyerczyk is a U.S. based seasoned technical analyst and educator with over 40 years of experience in market analysis and trading, specializing in chart patterns and price movement. He is the author of two books on technical analysis and has a background in both futures and stock markets.


Advertisement