
Advertisement
Advertisement
E-mini S&P 500 Index (ES) Futures Technical Analysis – November 11, 2015 Forecast
By:
December E-mini S&P 500 Index futures are trading higher shortly before the cash market opening. Today is a U.S. bank holiday so volume may be light
December E-mini S&P 500 Index futures are trading higher shortly before the cash market opening. Today is a U.S. bank holiday so volume may be light since the Treasury markets will be closed. The market is currently testing a short-term pivot level which is likely to determine the tone of the market today.
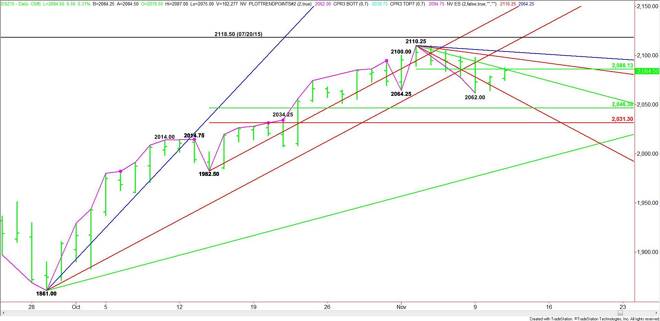
The main trend is down according to the daily swing chart. It turned down on Monday when the index traded through 2064.25. The inability to follow-through to the downside on Tuesday suggests that the previous days sell-off may have been triggered by sell-stops rather than short-selling.
The new short-term range is 2110.25 to 2062.00. Its pivot comes in at 2086.25. This level forms a resistance cluster with a short-term downtrending angle at the same price, making it the most important number on the chart today. Trader reaction to this price cluster will tell us whether the bulls or the bears are in control.
A sustained move over 2086.25 will signal the presence of buyers. This could trigger a surge into a pair of angles at 2098.25 and 2104.25. The latter is the last potential resistance angle before the 2110.25 main top.
The next target over 2110.25 is the July 20 main top at 2118.50.
A sustained move under 2086.25 will indicate the presence of sellers. The daily chart shows a little more room to the downside with 2062.25 the next potential target. Crossing to the weak side of this angle as well as the 2062.00 low will put the index in an extremely weak position.
Based on the main range of 1982.50 to 2110.25, the primary downside target is its retracement zone at 2046.25 to 2031.25.
Watch the price action and read the order flow at 2086.25. Trader reaction to this level will determine the direction of the market today.
About the Author
James Hyerczykauthor
James Hyerczyk is a U.S. based seasoned technical analyst and educator with over 40 years of experience in market analysis and trading, specializing in chart patterns and price movement. He is the author of two books on technical analysis and has a background in both futures and stock markets.


Advertisement