
Advertisement
Advertisement
E-mini S&P 500 Index (ES) Futures Technical Analysis – November 12, 2015 Forecast
By:
December E-mini S&P 500 Index futures are trading flat, shortly before the cash market opening. Volume is still light but it may pick up today with
December E-mini S&P 500 Index futures are trading flat, shortly before the cash market opening. Volume is still light but it may pick up today with the comments of several Fed speakers including Chair Janet Yellen. Volume and volatility are strongly expected to return on Friday with the release of the U.S. retail sales report.
The two day consolidation inside Monday’s wide range suggests impending volatility so be prepared for a big move.
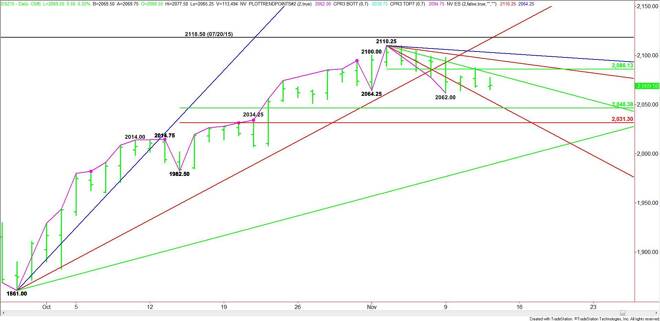
The main trend is down according to the daily swing chart. The trend turned down on Monday when sellers took out 2064.25. The selling pressure subsided at 2062.00, suggesting that the selling pressure under 2064.25 was probably triggered by sell stops rather than fresh shorting.
The main range is 1982.50 to 2110.25. Its retracement zone at 2046.25 to 2031.25 is the primary downside target.
The short-term range is 2110.25 to 2062.00. Its pivot or 50% level at 2082.25 is controlling the short-term direction of the market. This pivot stopped the market on Wednesday.
Based on Wednesday’s close at 2069.00, the first upside target is a downtrending angle at 2082.25. This is followed by the pivot at 2086.25.
Overtaking 2086.25 will signal the presence of buyers. However, any rally is likely to be labored because of downtrending angles at 2096.25 and 2103.25. The latter is the last potential resistance angle before the 2110.25 main top.
A sustained move under 2086.25 will indicate the presence of sellers. Sustaining the move under the downtrending angle at 2082.25 will indicate the selling pressure is strong.
The first downside target today is the low for the week at 2062.00. This is followed by the steep downtrending angle at 2054.25. This is followed by the 50% level at 2046.25, followed by the Fibonacci level at 2031.25.
Early in the session, watch the price action and order flow at 2082.25, however, the key level for the day is the pivot at 2086.25. Don’t be surprised by a strong technical bounce following a test of 2046.25 to 2031.25.
About the Author
James Hyerczykauthor
James Hyerczyk is a U.S. based seasoned technical analyst and educator with over 40 years of experience in market analysis and trading, specializing in chart patterns and price movement. He is the author of two books on technical analysis and has a background in both futures and stock markets.


Advertisement