
Advertisement
Advertisement
E-mini S&P 500 Index (ES) Futures Technical Analysis – November 3, 2015 Forecast
By:
December E-mini S&P 500 Index futures closed higher on Monday after rebounding from early session weakness. The index felt selling pressure during the
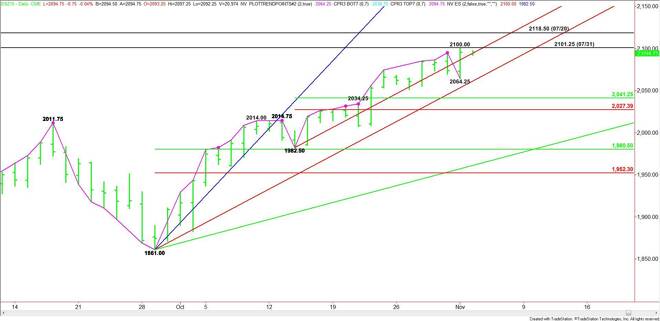
December E-mini S&P 500 Index futures closed higher on Monday after rebounding from early session weakness. The index felt selling pressure during the pre-market session. The selling was strong enough to take out 2069.75, confirming the closing price reversal top at 2094.75.
The selling took place in the pre-market session in response to weak data from China. U.S. investors took advantage of the lower prices and began driving the market higher on the regular session opening. The buying was strong enough to take out 2094.75, negating the closing price reversal top and making 2064.25 a new minor bottom.
The rally stopped at 2100.00, just shy of the July 31 main top at 2101.25. The close was at 2095.50.
If investors continue to buy strength then look for them to go after 2101.25 early Tuesday. A sustained move over this level will signal the presence of buyers with the next potential target the July 20 main top at 2118.50.
A sustained move under 2101.25 will indicate the presence of sellers. However, don’t expect an acceleration to the downside unless the short-term uptrending angle at 2094.50 is taken out with conviction.
If the index starts to accelerate to the downside on a sustained move under 2094.50 then yesterday’s low at 2064.25 becomes the next downside target, followed closely by a long-term uptrending angle at 2061.00.
If 2061.00 is taken out then the primary downside target becomes the short-term retracement zone at 2041.25 to 2027.25.
The index is still in the window of time for a potentially bearish closing price reversal top.
Watch the price action and read the order flow at 2101.25 today. A sustained move over this level will set a bullish tone. A sustained move under this level will set a bearish tone.
Taking out 2100.00 and breaking back under 2095.50 will indicate that the selling is greater than the buying at current price levels.
About the Author
James Hyerczykauthor
James Hyerczyk is a U.S. based seasoned technical analyst and educator with over 40 years of experience in market analysis and trading, specializing in chart patterns and price movement. He is the author of two books on technical analysis and has a background in both futures and stock markets.


Advertisement