
Advertisement
Advertisement
E-mini S&P 500 Index (ES) Futures Technical Analysis – October 9, 2014, Forecast
By:
After taking out the previous main bottom by only one tick on Wednesday, December E-mini S&P 500 Index futures reversed to the upside, finishing
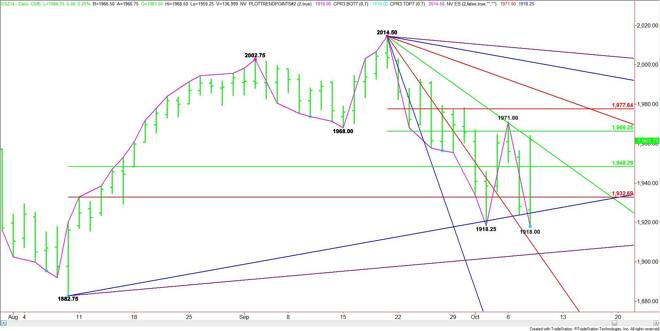
After taking out the previous main bottom by only one tick on Wednesday, December E-mini S&P 500 Index futures reversed to the upside, finishing slightly below the last swing top at 1971.00. A trade through this price will turn the main trend to up on the daily chart.
The strong close indicates there may be enough upside momentum to fuel an early session rally, but bullish traders still have to deal with a downtrending angle, a main top and a retracement zone before the index can accelerate to the upside.
On the upside, the first key angle to watch drops in at 1958.50. The close at 1961.75 was over this angle so look for a steady to better opening. Falling back below this level will indicate weakness.
The main range is 2014.50 to 1918.00. The retracement zone formed by this range at 1966.25 to 1977.75 is today’s first major target. The swing top at 1971.00 falls inside this zone, validating its importance. Bearish traders are likely to come in the market inside this zone.
If the momentum is strong enough then look for a breakout over 1977.75 to trigger a rally into the next downtrending angle at 1986.50.
The tone of the day will be determined by trader reaction to the angle at 1958.50.
About the Author
James Hyerczykauthor
James Hyerczyk is a U.S. based seasoned technical analyst and educator with over 40 years of experience in market analysis and trading, specializing in chart patterns and price movement. He is the author of two books on technical analysis and has a background in both futures and stock markets.


Advertisement