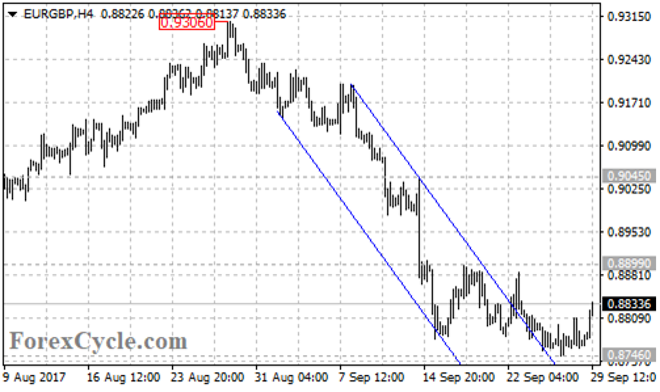
EURGBP recently broke out of a price channel on its 4-hour chart and moved sideways in a trading range between 0.8746 and 0.8899, suggesting that
EURGBP recently broke out of a price channel on its 4-hour chart and moved sideways in a trading range between 0.8746 and 0.8899, suggesting that consolidation for the bearish movement from 0.9306 is underway.
The EURGBP pair could be expected to continue its downside movement after the sideways consolidation and a breakdown 0.8746 support could signal resumption of the downtrend. Then the pair would find next support level at the 61.8% Fibonacci retracement taken from 0.8313 to 0.9306 at around 0.8690, followed by the 76.4% retracement at 0.8545.
On the other side, a break out of 0.8899 resistance could indicate that lengthier correction for the downtrend is needed, then the pair would find next resistance level at 0.9045. However, the 0.9045 level could be treated as key resistance for the downtrend, another fall could be seen before breaking above this level.
For long term analysis, the EURGBP pair failed in its two attempts to break through 0.9300 area, creating a double top pattern on its weekly chart with neckline at 0.8304. A breakdown below the neckline could confirm the reversal formation, then an additional measured movement could take price to 0.7300 area.
Support levels: 0.8746 (near term support), 0.8690 (the 61.8% Fibonacci retracement), 0.8545 (the 76.4% Fibonacci retracement), 0.8304 (the neckline of the double top pattern), 0.7300 (the measured move target).
Resistance levels: 0.8899 (near term resistance), 0.9045 (key resistance), 0.9306 (the August 29 high).