



US Dollar News: Fed and ECB Meetings Drive FX Outlook
The focus returns to the Federal Reserve meeting this week in between the European Central Bank’s July 23 meeting, and data has continued to drive expectations for both central banks. The US dollar gained last week after the economy continued to show signs of stability, with June retail sales rising 0.2% m/m, core retail sales up 0.5% m/m and initial jobless claims dropping to 208K, down to a two-month low. Those data points led markets to assume the Fed will hold rates steady at the end of the month while signalling that policy will remain data dependent.
The spotlight now turns to the US’ flash PMI releases later in the week, which will provide one of the last readings of US activity for policymakers before they convene on July 29-30. Investors will also keep an eye on the situation in the Middle East, where higher energy prices have again raised concerns that inflationary pressures will linger despite recent progress.
Meanwhile, the ECB has come under scrutiny in recent weeks, with markets widely assuming they will leave the deposit rate at 2.25% in July after the June hike. Policymakers will be open to further tightening later this year should inflationary pressures re-emerge. Lending surveys showed further tightening in credit standards for firms and the first signs of a rebound in credit demand in Q2.
The pound remains tethered to monetary and fiscal policy developments. The Bank of England could hold at 3.75% later this month while markets digest the impact of the new UK government’s tax and spending plans. Latest data showed public borrowing in June totalled £16bn, with annual wage growth holding firm at 3.4%. That is expected to lead the BoE to remain balanced against inflation risks and economic growth headwinds.
US Dollar Index (DXY) Technical Analysis: Uptrend Holds as Buyers Defend Key Support
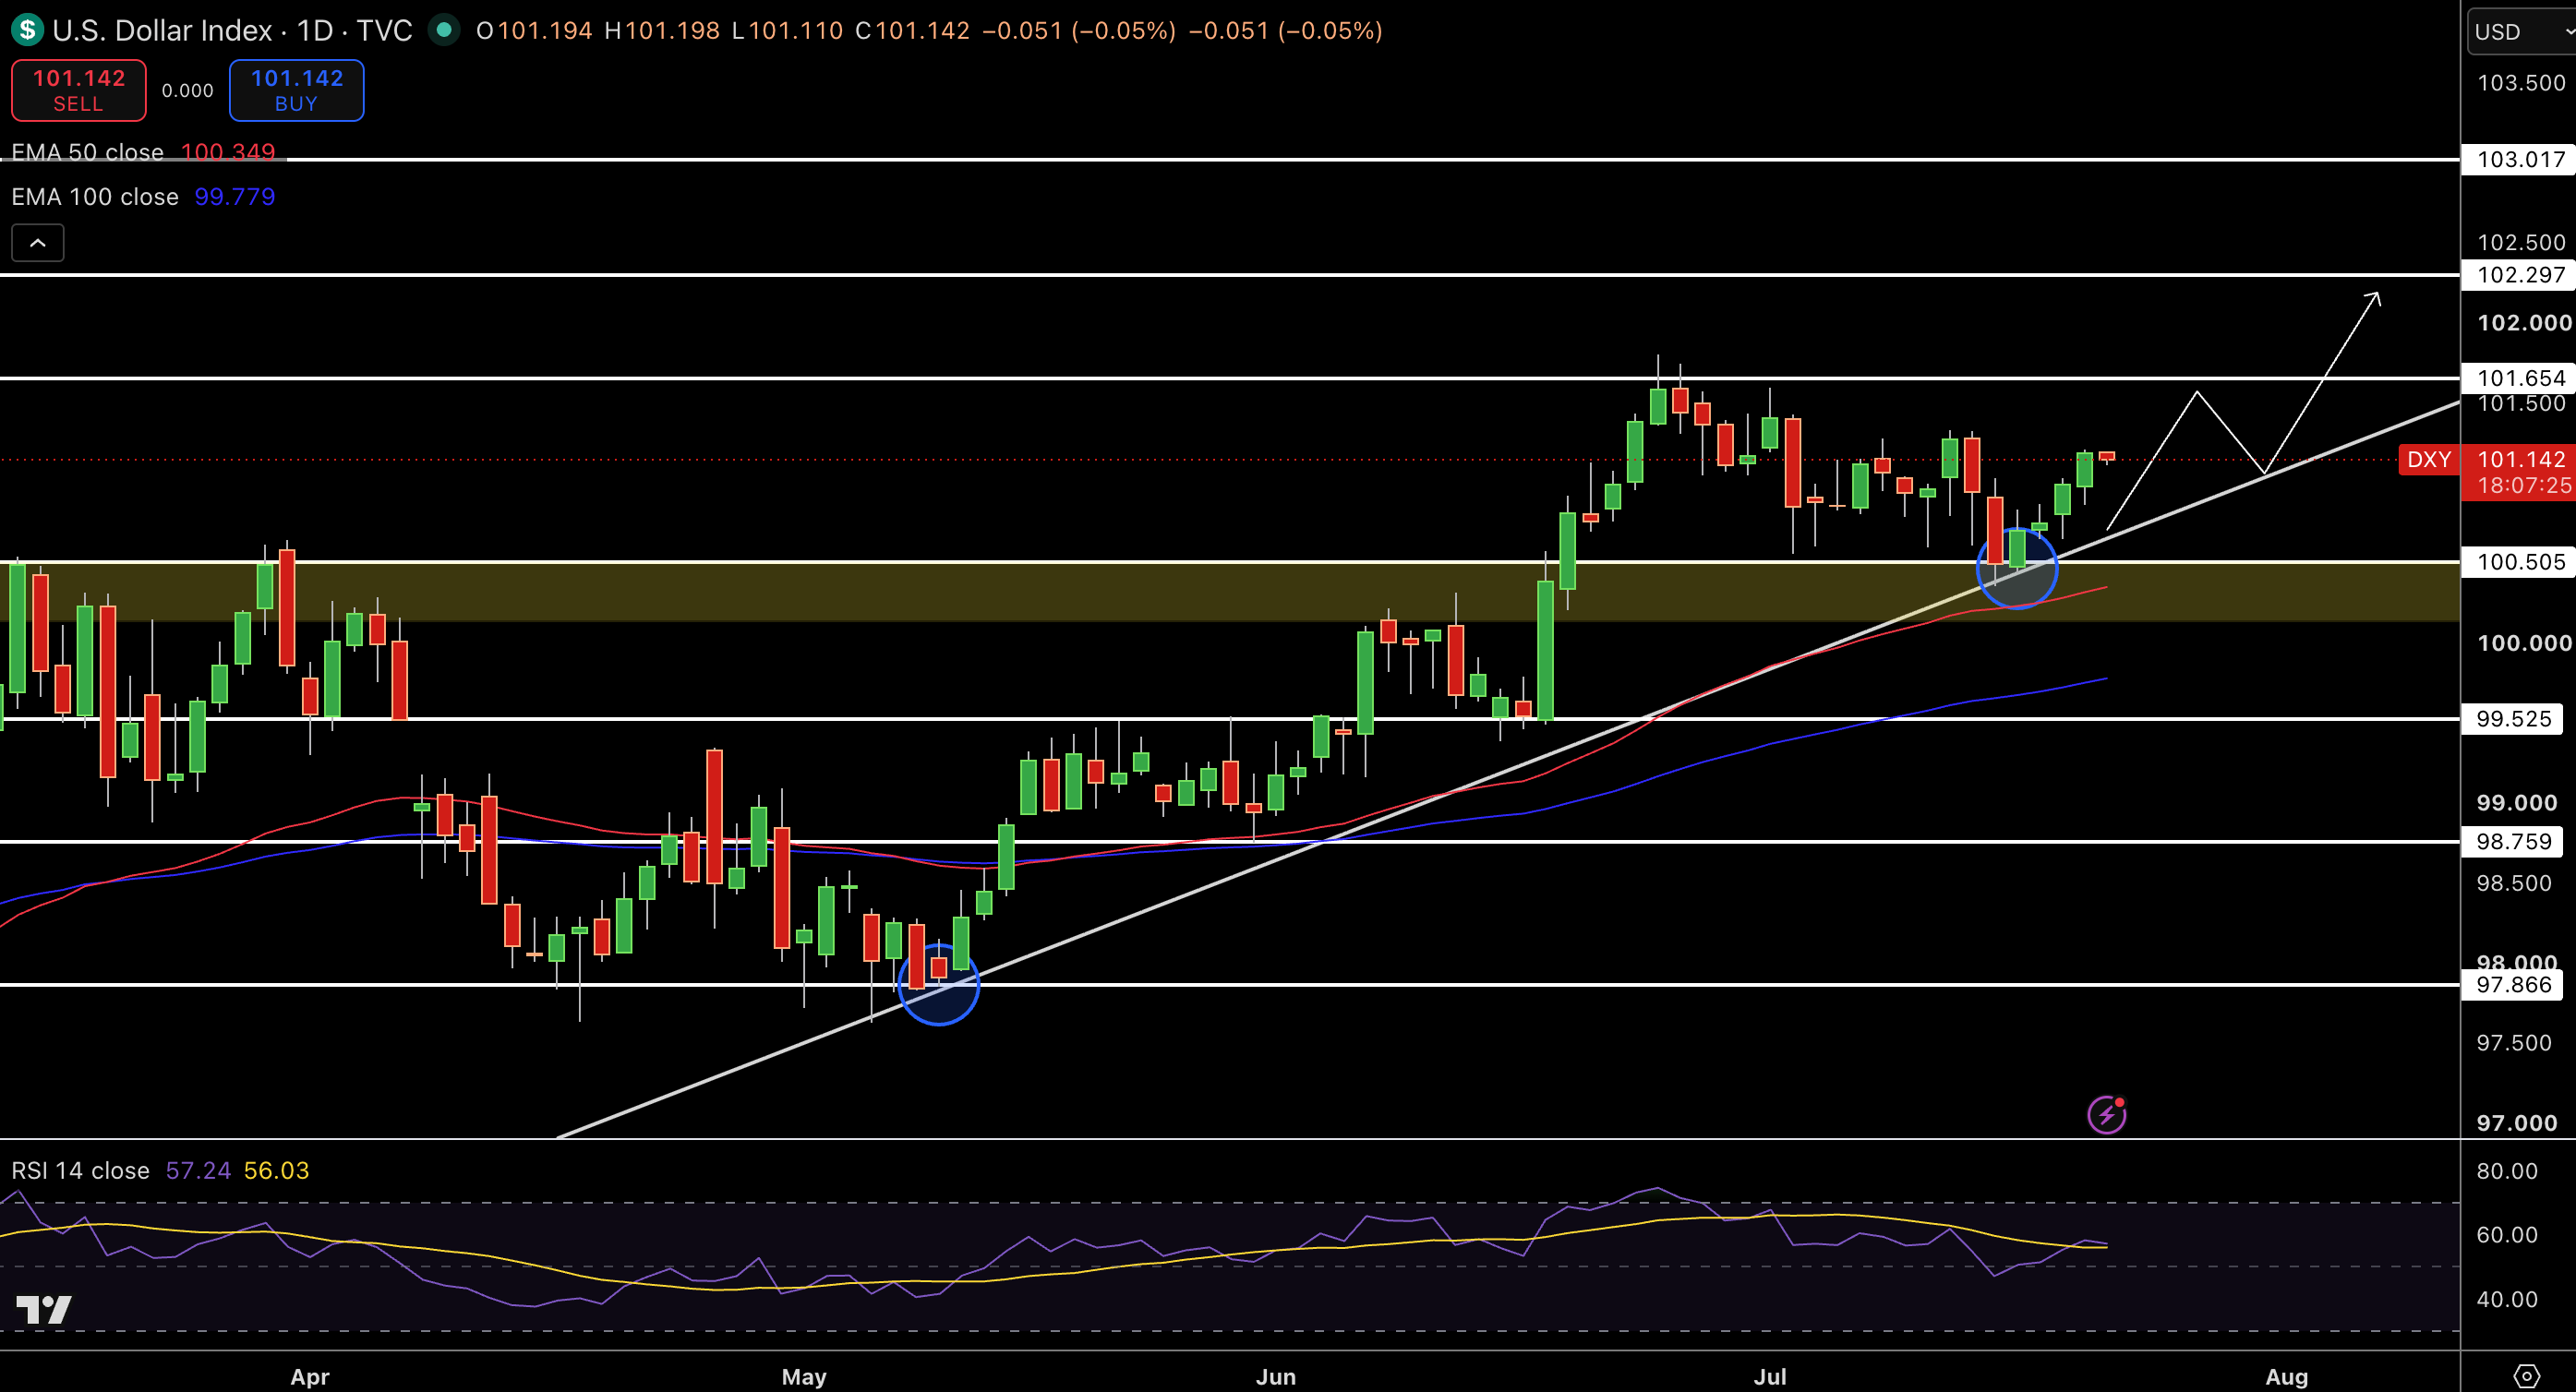
The US Dollar Index (DXY) is maintaining the medium-term uptrend as the price managed to defend the demand zone around 100.50 and the rising trendline on the daily timeframe. Currently, it is seen changing hands near the 101.14 area above the 50-EMA (100.35) and the 100-EMA (99.78) on the daily chart, and the bulls continue to be in control.
Price faced some initial resistance around the 101.65 level with resistance at 102.30, and then 103.02. On the downside, support is seen near 100.50, then 99.53, and then 98.76. The RSI recovered to the 57 level, indicating that the bullish trend continues.
Technically, the trendline support area witnessed its retest and price bounced off it, reinforcing the bullish trend. The price is expected to continue to the upside as long as the 100.50 level continues to hold the support. The bears are likely to lose control of the market and buyers will move prices towards 101.65 and then 102.30, but the support at the 100.50 level is critical and any failure will open up the downside for the price and it will fall towards 99.50.
GBP/USD Price Forecast
Every new GBP/USD analysis as it publishes, today's technical signal and key levels, live price — on one page.
See all GBP/USD forecastsGBP/USD Technical Analysis: Bears Test Channel Support Below Key Moving Averages
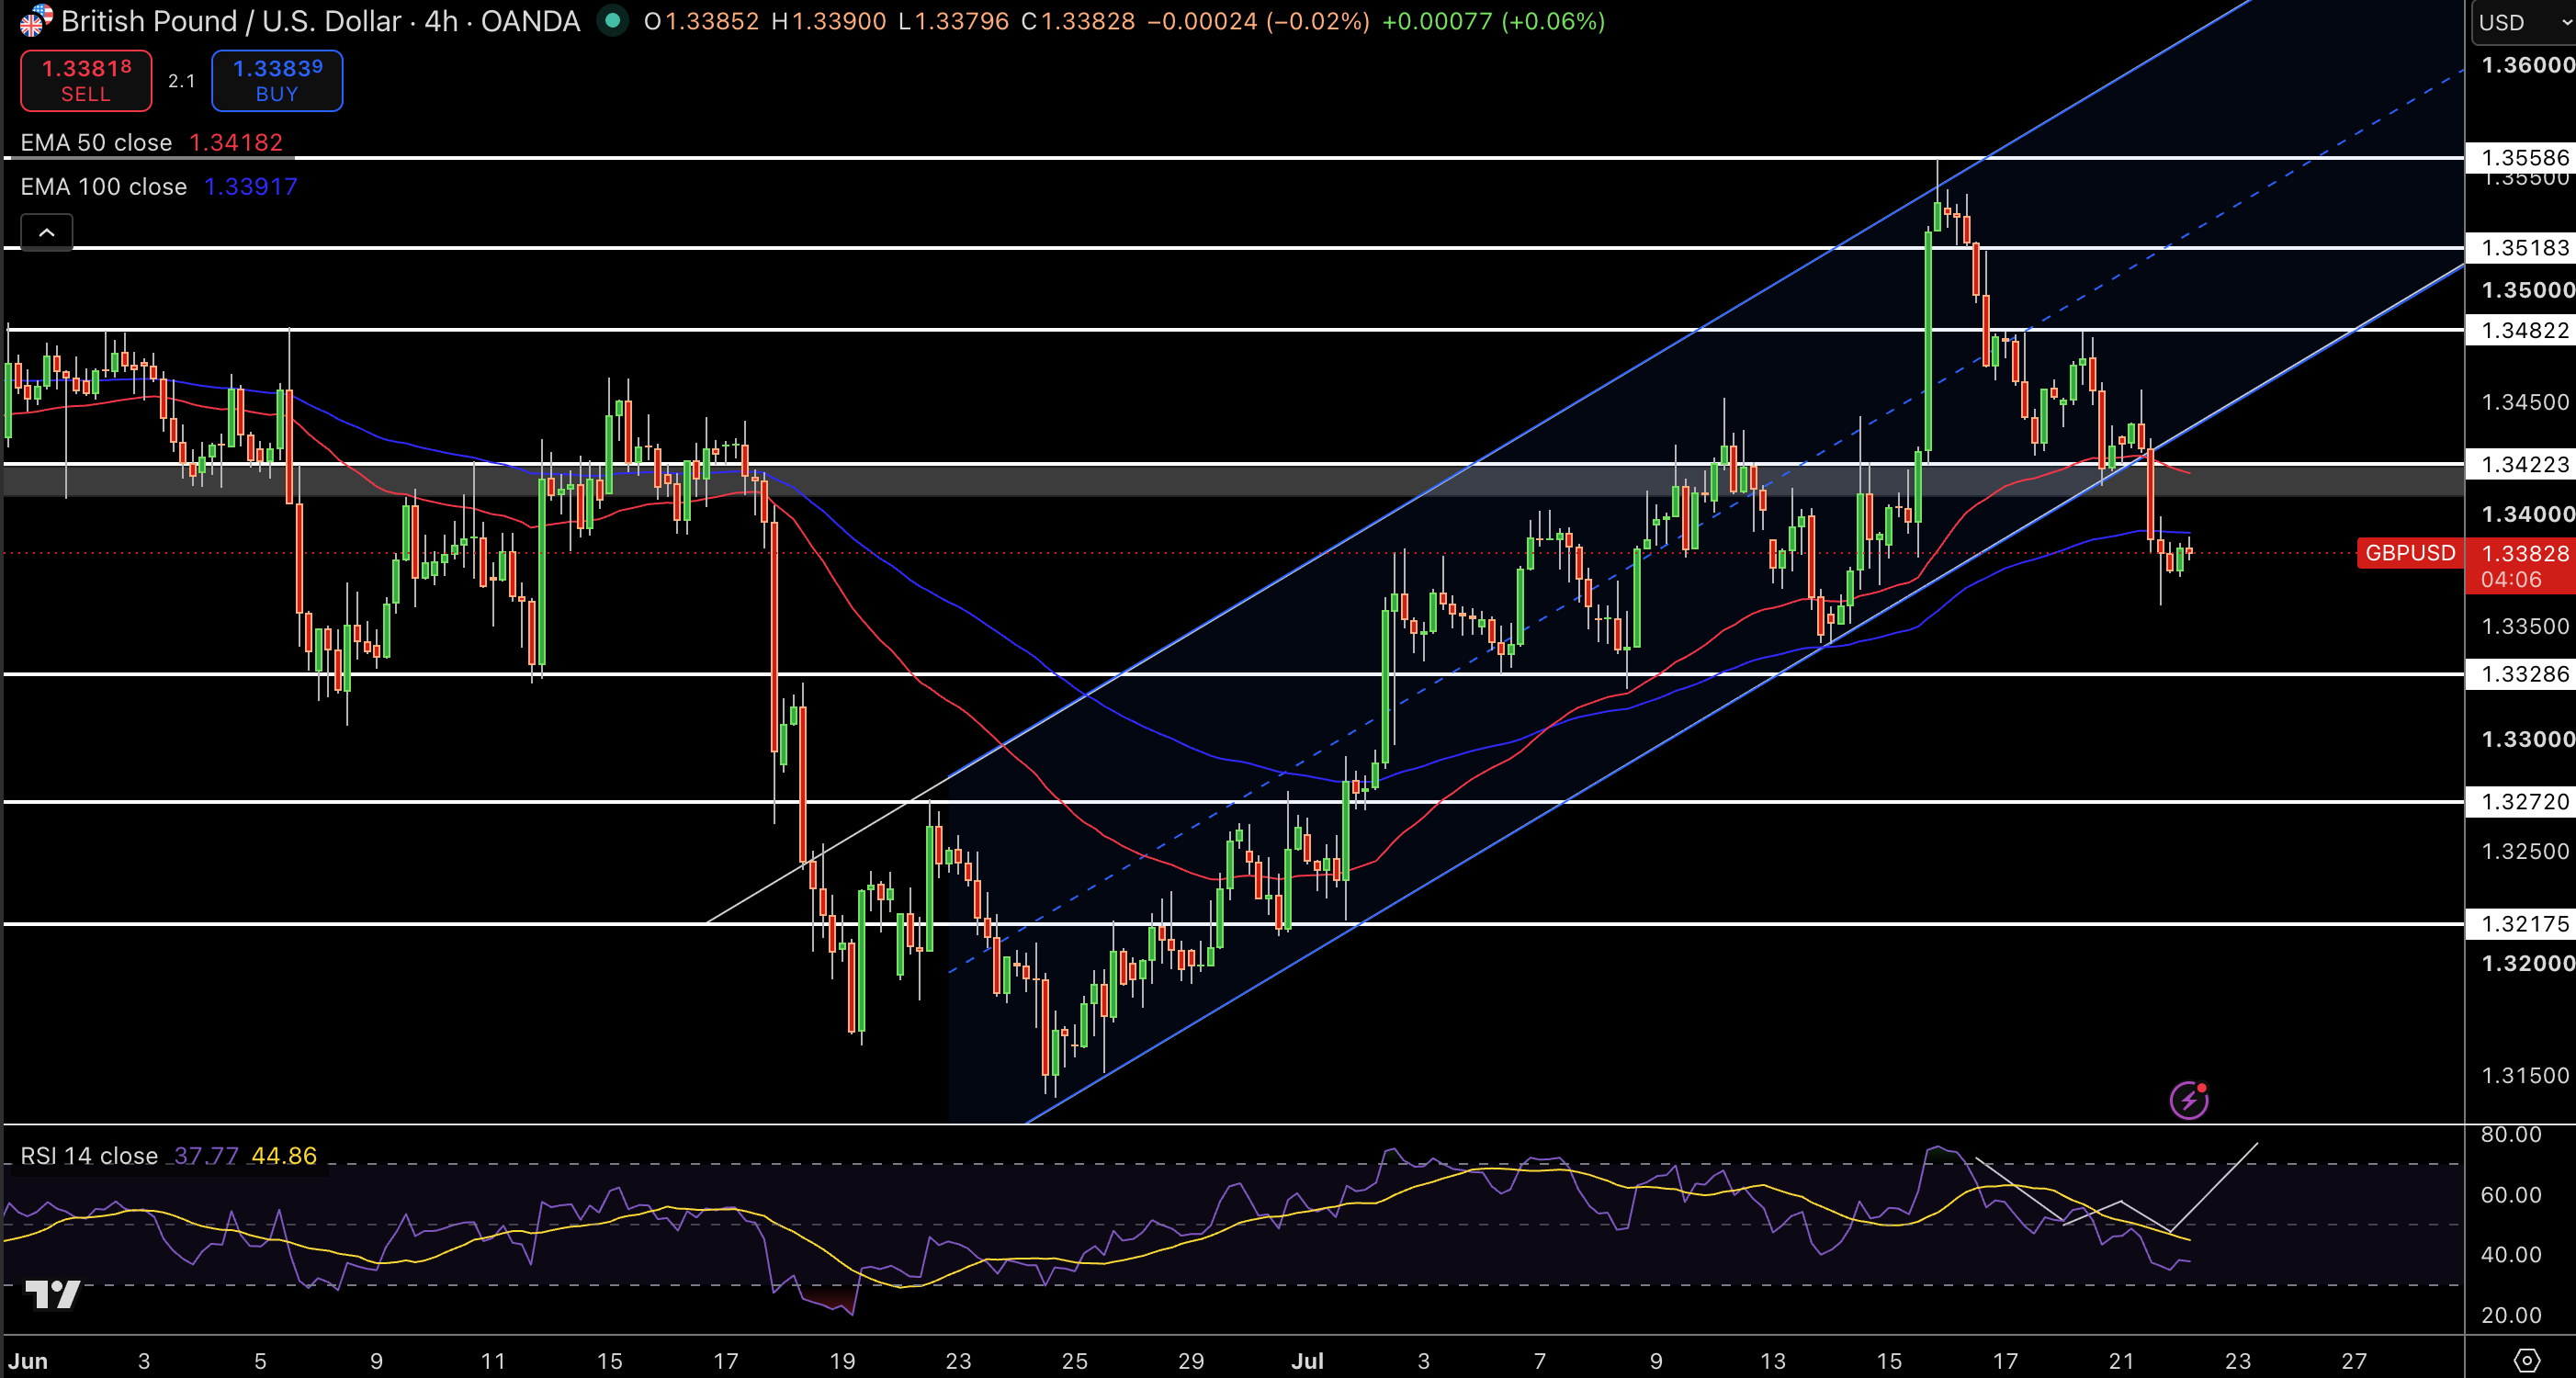
GBP/USD is trading below the rising channel and the price has also broken the support at both the 50-EMA (1.3418) and 100-EMA (1.3392) on the 4-hour chart, indicating that the downside momentum continues on the short-term. At the time of writing, GBP/USD is near the 1.3383 level and the pair is attempting to defend the horizontal level after the previous sell-off.
The price is finding resistance around the 1.3422 level with resistance at 1.3482, and then 1.3518. The sellers could try to push the price down from here. On the downside, the first support area is found near 1.3329 and then 1.3272, and then 1.3218. The RSI is around 38, indicating that the downside momentum is dominant but is approaching the oversold level.
Technically, the price action will start to favor the buyers only after the 1.3422 level is regained and attention will again shift towards 1.3480. However, unless that level is reclaimed, the bears are likely to push the price down from here and further test the 1.3330 support.
EUR/USD Technical Analysis: Triangle Support Holds, Bulls Eye 1.1450 Breakout
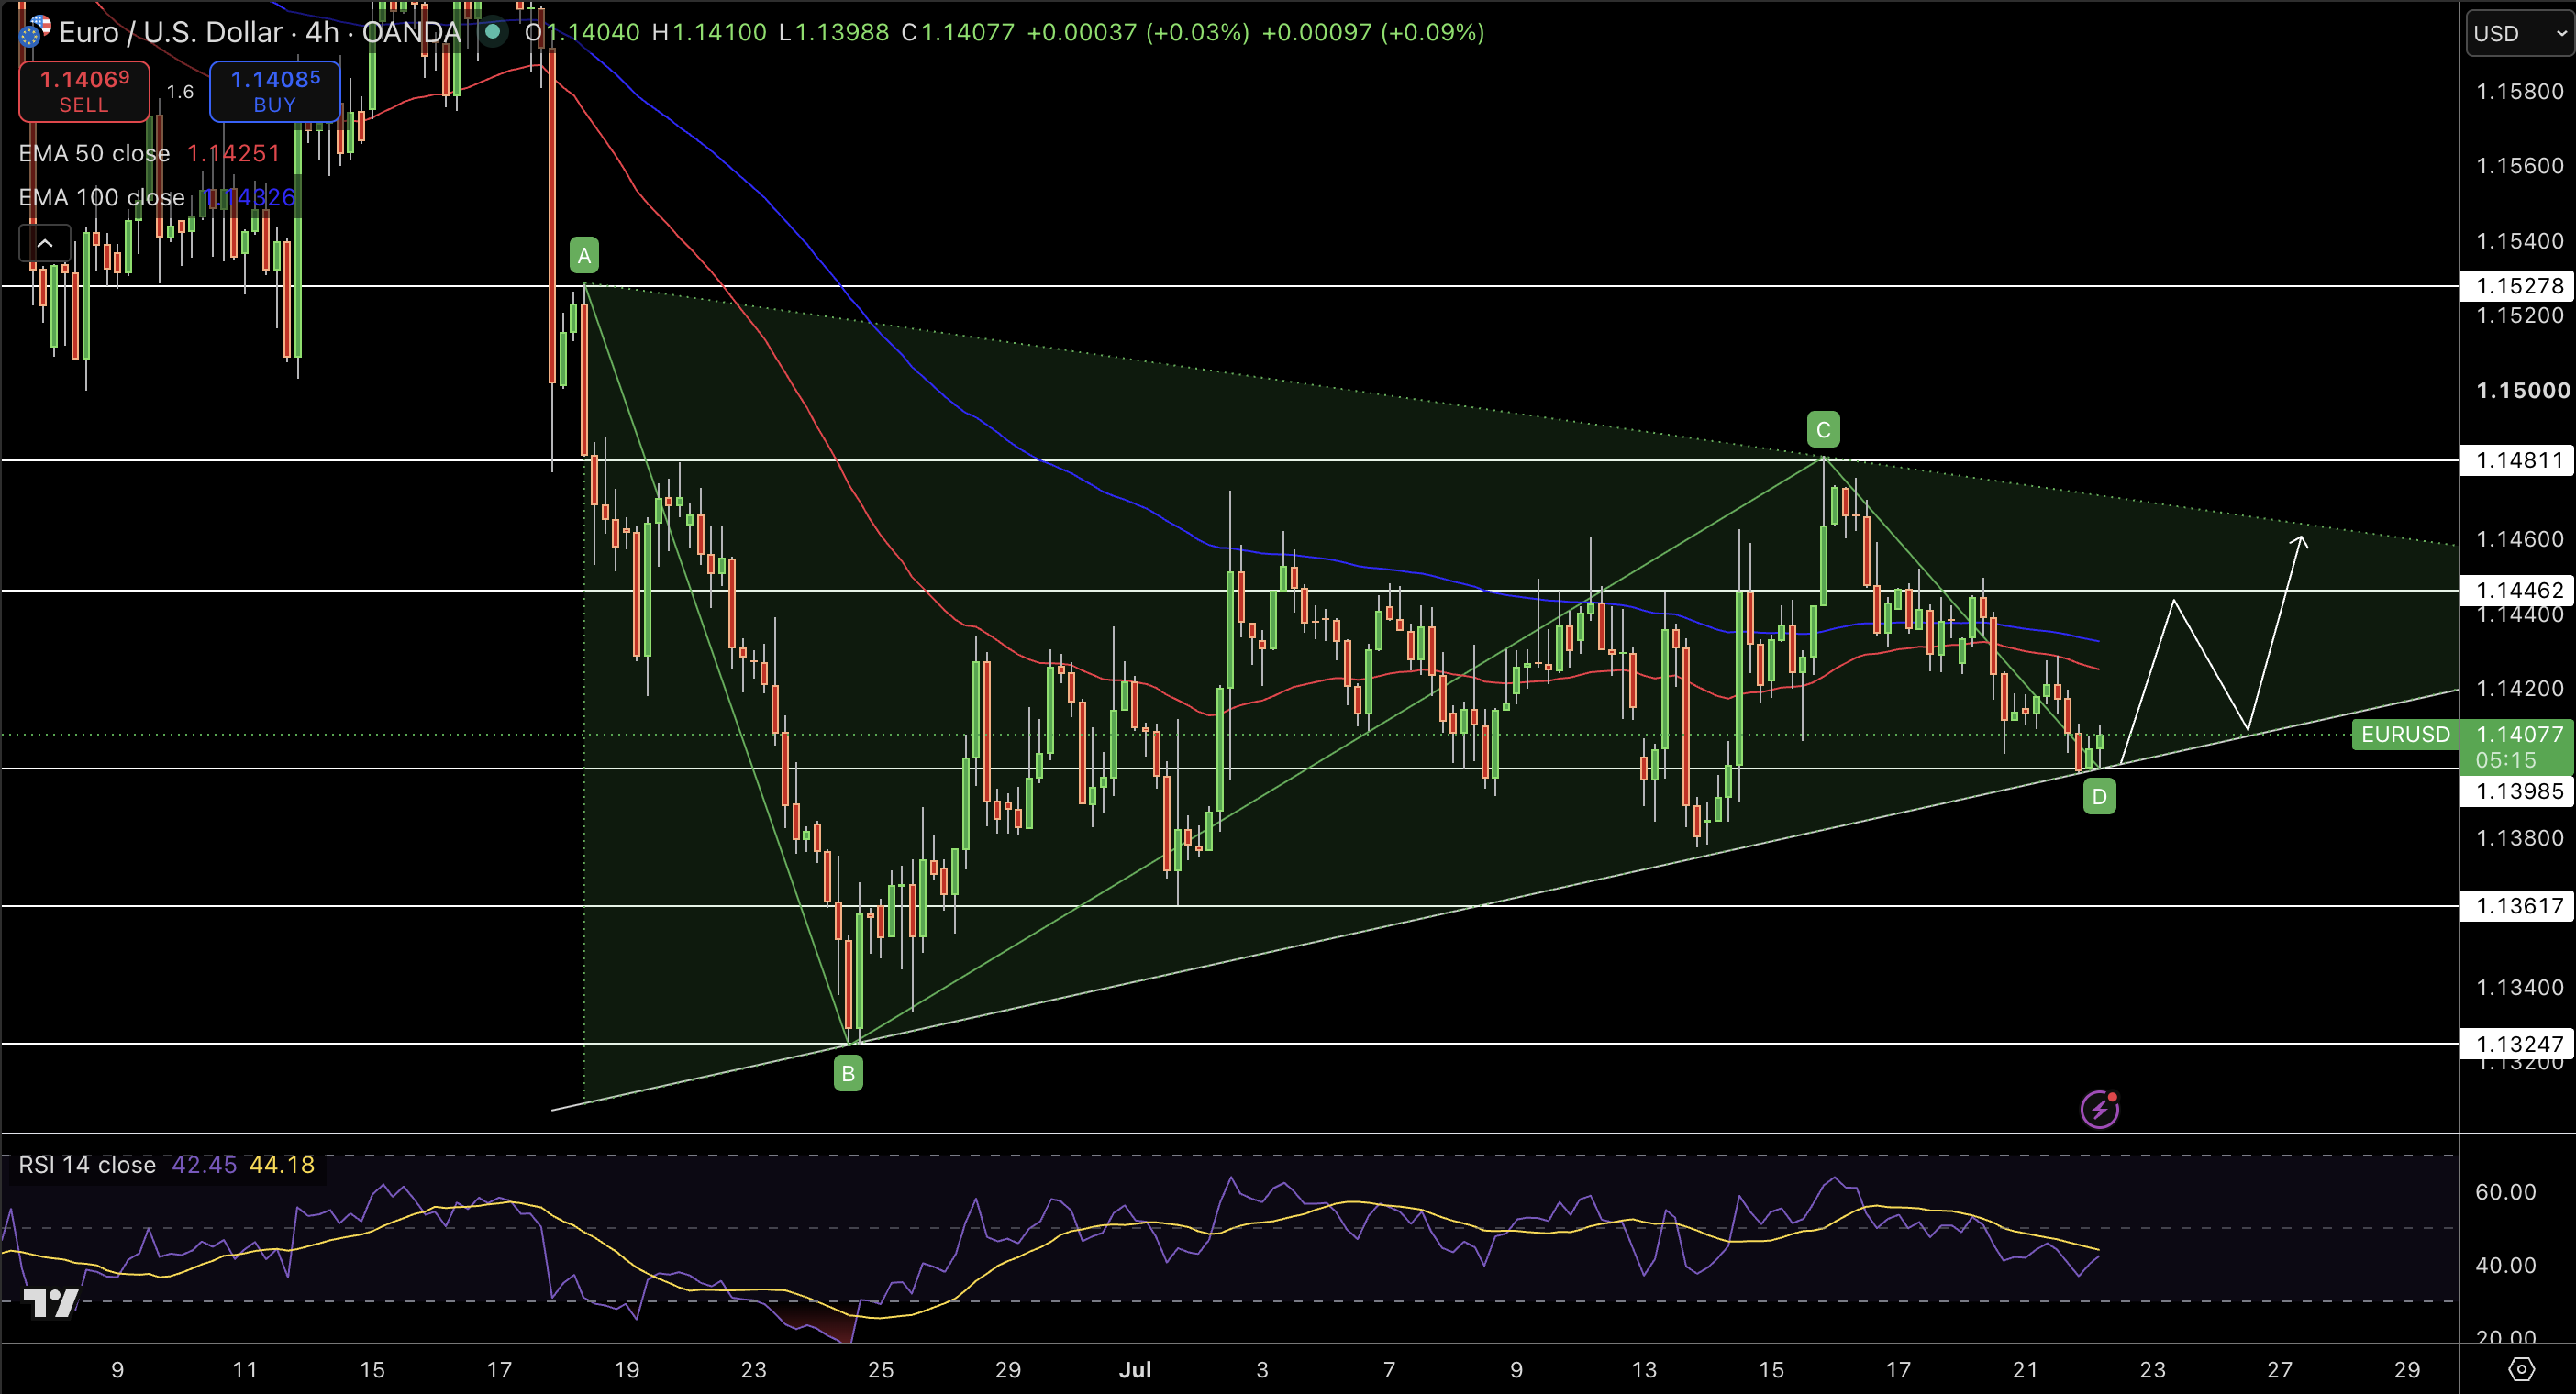
EUR/USD is trading within the triangle pattern on the 4-hour timeframe as the bulls defended the demand zone around 1.1400, marked by the rising trendline after the previous decline. The price remains below the 50-EMA (1.1425) and the 100-EMA (1.1433) on the 4-hour chart and the bulls will have to cross these moving averages for an uptrend confirmation.
The pair is finding immediate resistance near 1.1446 with resistance at 1.1481 and the triangle top at 1.1528. On the downside, the first support is found near 1.1399, then 1.1362, and then 1.1325. The RSI is around 42, indicating the downside momentum is slowing down but the bulls do not control the pair yet.
Technically, the price action on the 4-hour chart is looking constructive for the bulls as long as the support at 1.1400 is holding firm. If the pair breaks above the 1.1450 level, it will confirm the bullish triangle pattern and the price will move higher towards 1.1480 and 1.1530, but any breakdown below the 1.1399 level will indicate further downside and the price will likely test the 1.1360 support level.