


Gold (XAU) prices consolidate around $4,410 and remain under bearish pressure during early trading on Monday. Crude oil prices remain strong as tensions between the US and Iran escalate. Brent crude oil reached $98.30 while WTI oil hit $92. The escalation between the US and Iran could drive greater safe-haven demand for gold. But rising oil prices could also keep inflation at higher levels. This could support Treasury yields and strengthen the US dollar, which may pressure gold. The market now expects 50% odds of rate hike in September. Therefore, the inflation report on Friday could make a difference.
Silver (XAG) is trading around $66 per ounce and shows stronger momentum in the short term as compared to gold. A hot inflation report could also put pressure on silver through a stronger dollar and higher yields. An extended oil shock may affect global growth and could negatively impact the industrial demand for silver. In my view, silver may consolidate above $60 as the market waits for the inflation report to determine the next direction.
Gold Price Forecast: $4,250–$4,530 Range Defines Next Move
XAU/USD Consolidates Between Key Moving Averages
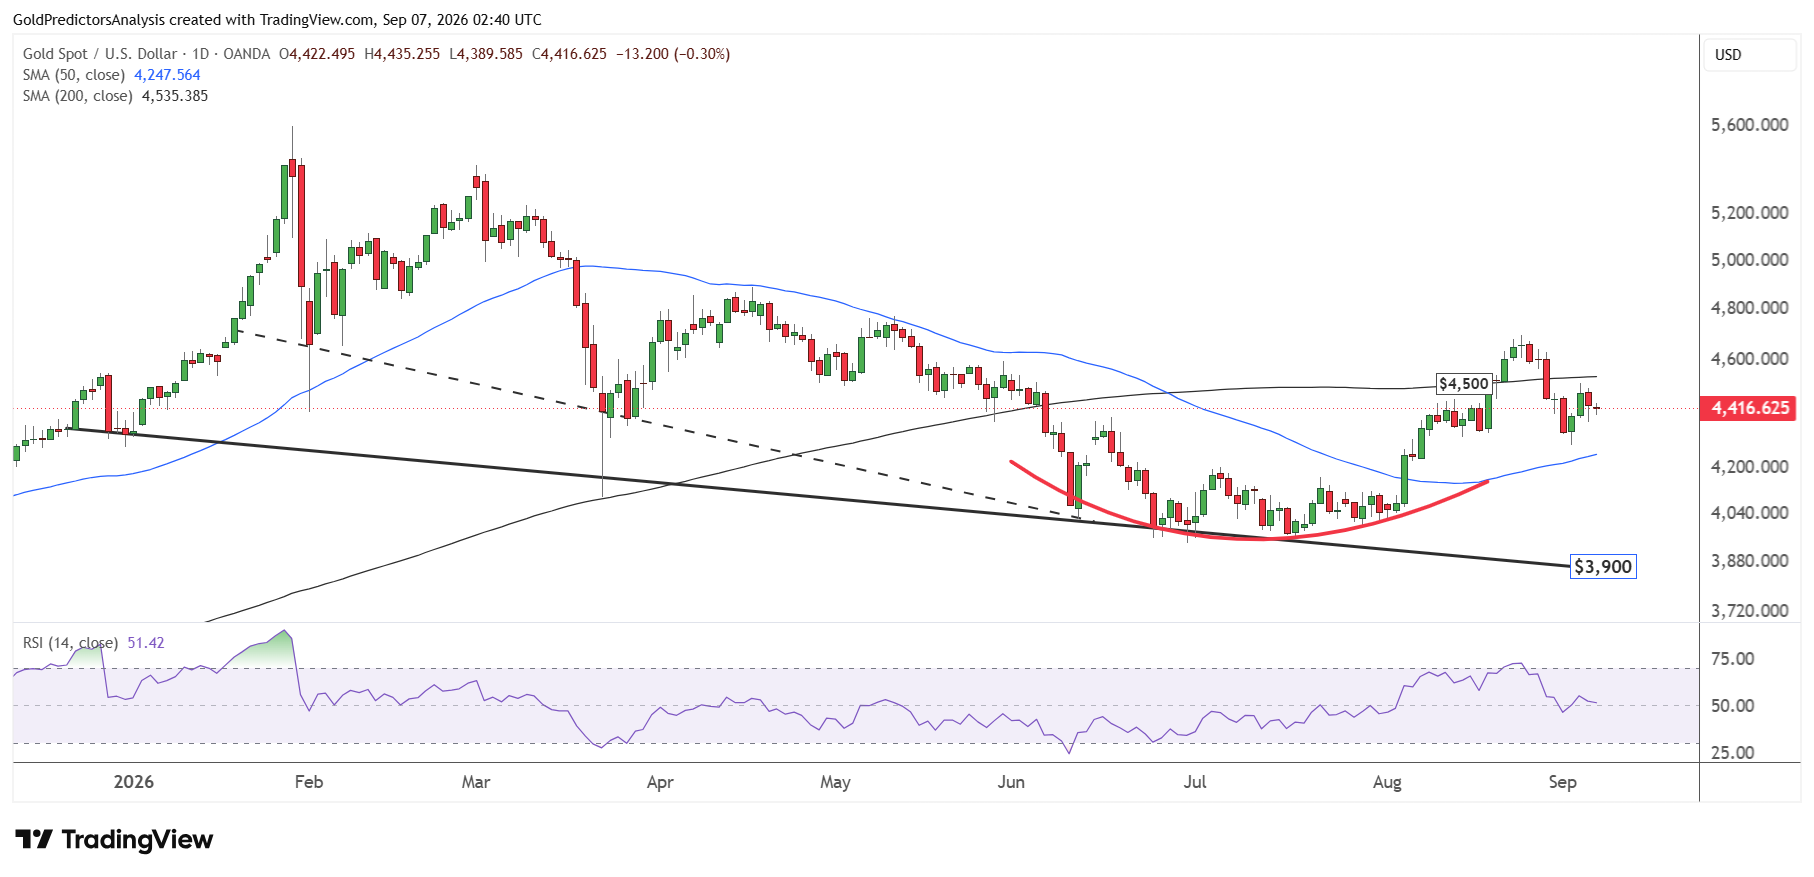
The daily chart for spot gold shows that the price has been consolidating between the 50- and 200-day SMAs, between $4,530 and $4,250. A break of either level may define the next move in the gold market. A break below $4,250 will open the way to $4,000. This level is the strong long-term support in the gold market.
On the other hand, a break above $4,530 will indicate a strong move toward the $5,000 level. The RSI remains above the midline, which points to positive price action in the short term. However, the strong jobs data has pushed the U.S. dollar index higher, which keeps gold rallies limited.
Short-Term Gold Outlook: $4,530 Remains Key Resistance
The 4-hour chart for spot gold also shows strong consolidation above the $4,300 area. The price failed to break above the $4,480-$4,500 area. The $4,530 level is the initial resistance. The formation of a rounding bottom pattern in June and July is constructive, but a break below $4,300 will indicate negative price action and open the way toward $4,000.
Gold Price Forecast
Every new Gold analysis as it publishes, today's technical signal and key levels, live price — on one page.
See all Gold forecasts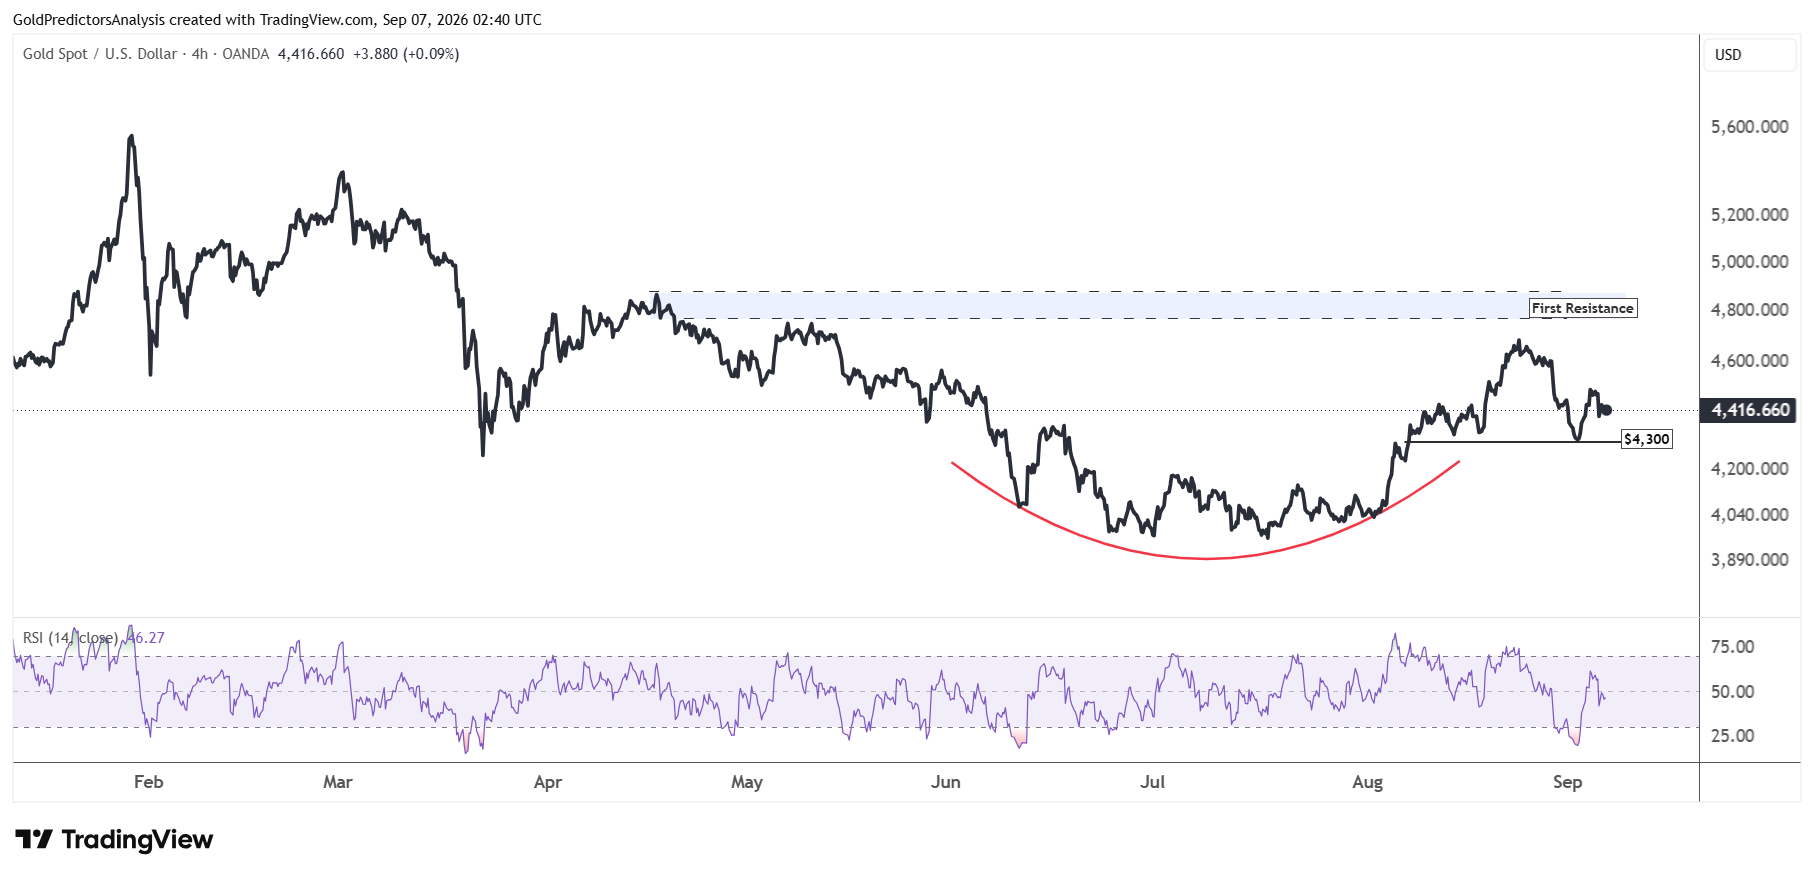
Silver Price Forecast: $60 Support and $72 Resistance in Focus
XAG/USD Needs a Break Above $72 to Target $90
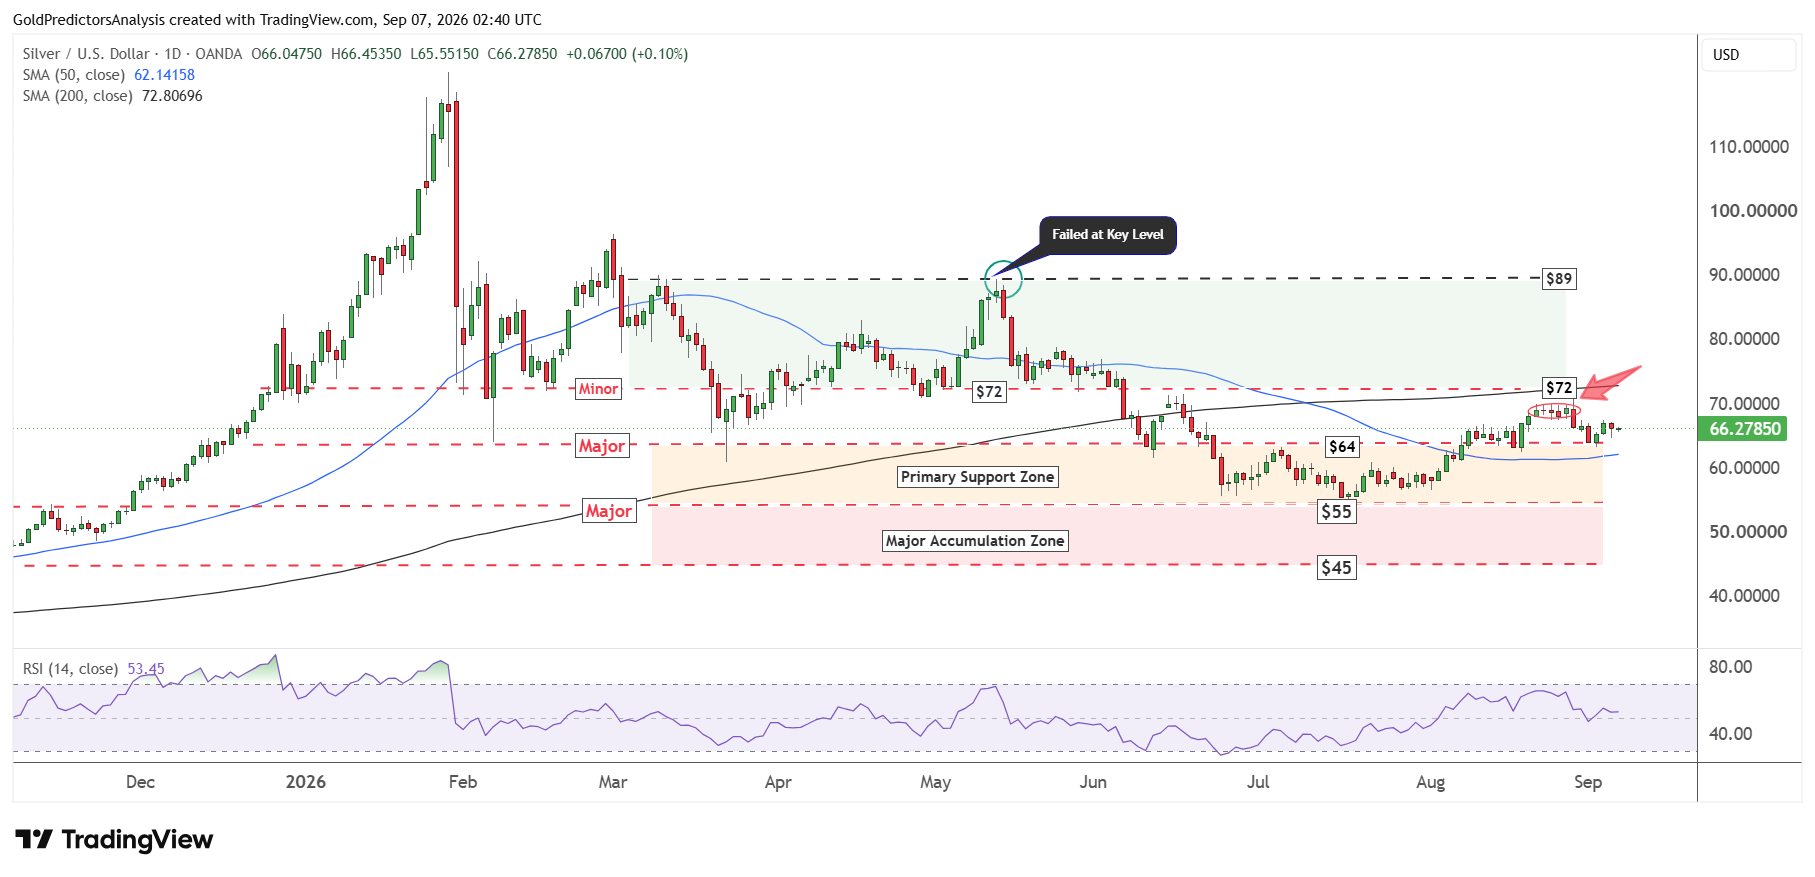
The daily chart for spot silver also shows strong consolidation above the $64 support level. The price has been consolidating between the 50- and 200-day SMAs. A break above $72 is required to open the way toward the $90 resistance area.
On the other hand, a break below $60 will indicate further downside toward the $50-$55 support zone. Overall, the price still remains above the $60 support, which keeps the bullish momentum in the silver market.
Silver Risks a Drop Toward $60 Below $64
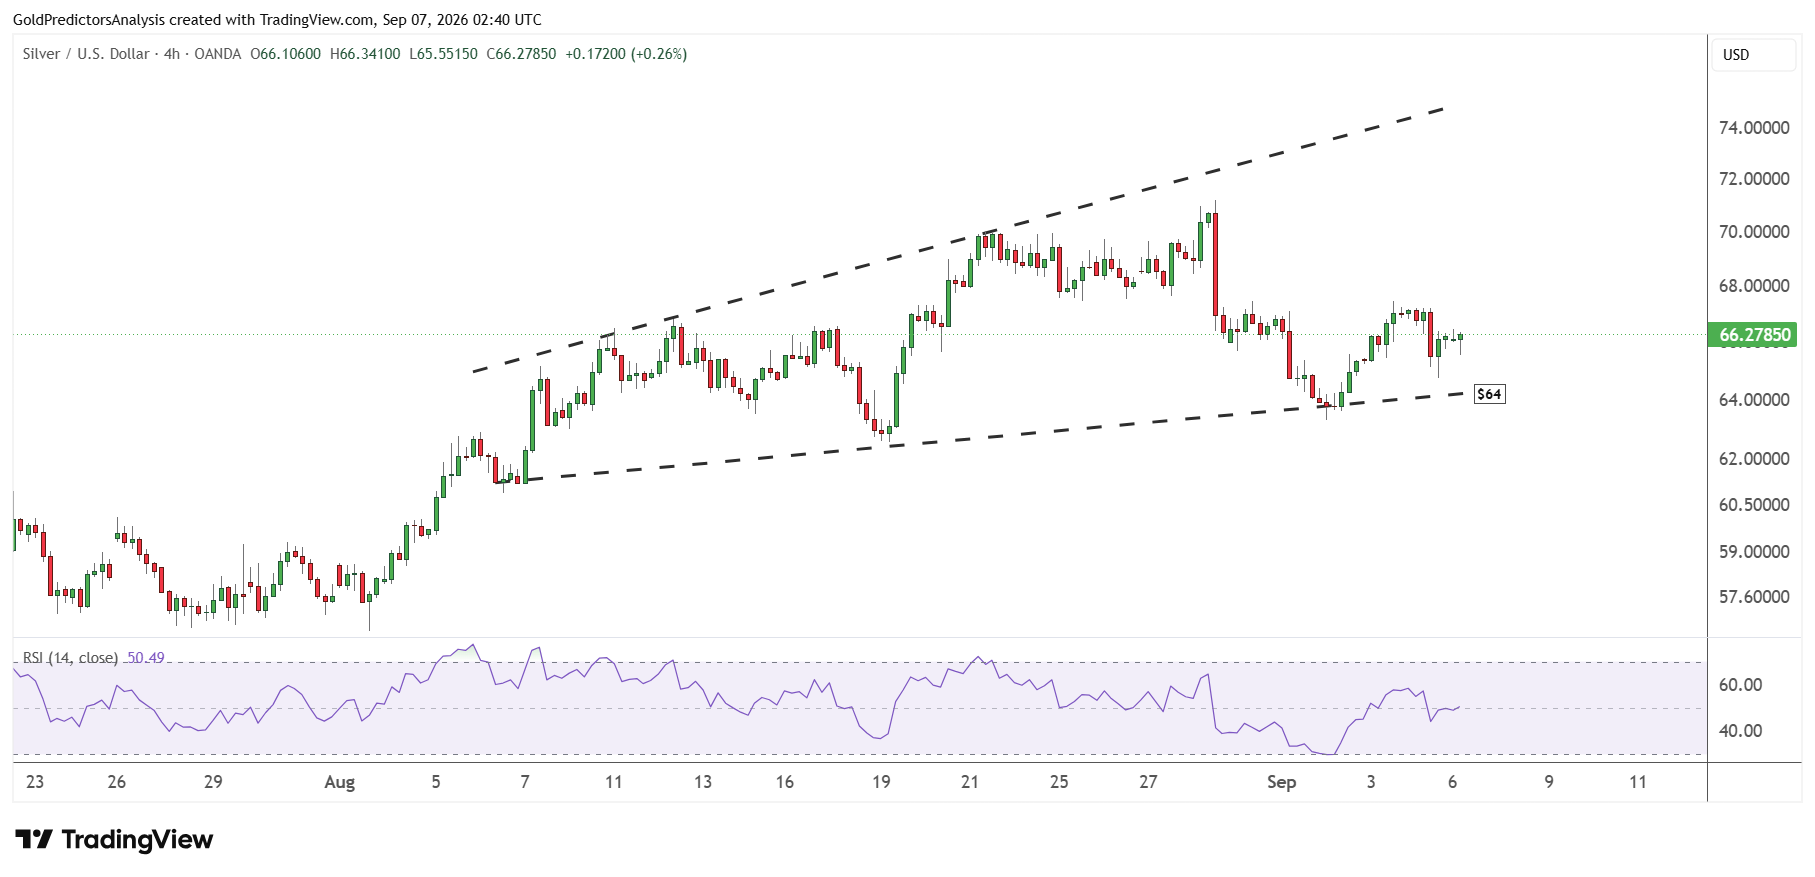
The 4-hour chart for spot silver shows the formation of ascending broadening wedge pattern. The emergence of a broadening wedge highlights strong volatility. The formation of this wedge indicates that a break below $64 this time may initiate a drop toward the $60 area. The RSI remains below the midline, which indicates negative price action in the short term. But a break above $72 will open the way for higher prices.
What Is Next for Gold and Silver Prices?
Gold and silver prices may remain volatile ahead of the inflation report on Friday. Hot inflation could raise expectations of a rate hike in September. This may lift the US dollar and Treasury yields and put pressure on both metals. But if the inflation data is softer, it could support a recovery in metals.
Traders should also monitor oil prices and tensions between US and Iran. Gold needs to hold the support of $4,250 and break above $4,530 to strengthen the bullish outlook. Silver must remain above $60 and break $72 to open the way for $90. In my view, both metals may continue to consolidate until the inflation data provides a clear signal for the interest rate decision in September.