



Gold News: Fed and ECB Decisions Dominate Outlook
Gold and silver look to have quite an eventful week ahead as investors prepare for the upcoming Federal Reserve meeting July 29-30 and the European Central Bank policy meeting July 24. Both central banks are widely expected to maintain interest rates but will need to give markets a sense of whether the second half of this year will see rates unchanged, higher or lower after recent U.S. data indicating retail sales increased 0.2% in June and first time claims for unemployment benefits dropped to 208000.
Long term gold market support comes from central banks, with the World Gold Council reporting net purchases of 41 tonnes in May behind Poland (18 tonnes) and China (10 tonnes). China is the eighth month in a row the country has added to official gold holdings as the total now stands at 2331 tonnes. 89% of central banks expect reserves globally to increase over the next 12 months.
Silver’s long term fundamentals remain constructive as demand from the solar energy industry, artificial intelligence and electronics continues to outpace the supply of the precious metal, the Silver Institute said. Analysts believe that industrial demand will remain above 700 million ounces this year and continue to support silver’s price despite lower investment demand from high interest rates.
Gold Technical Analysis: XAU/USD Breaks Triangle Resistance, Bulls Target $4,200
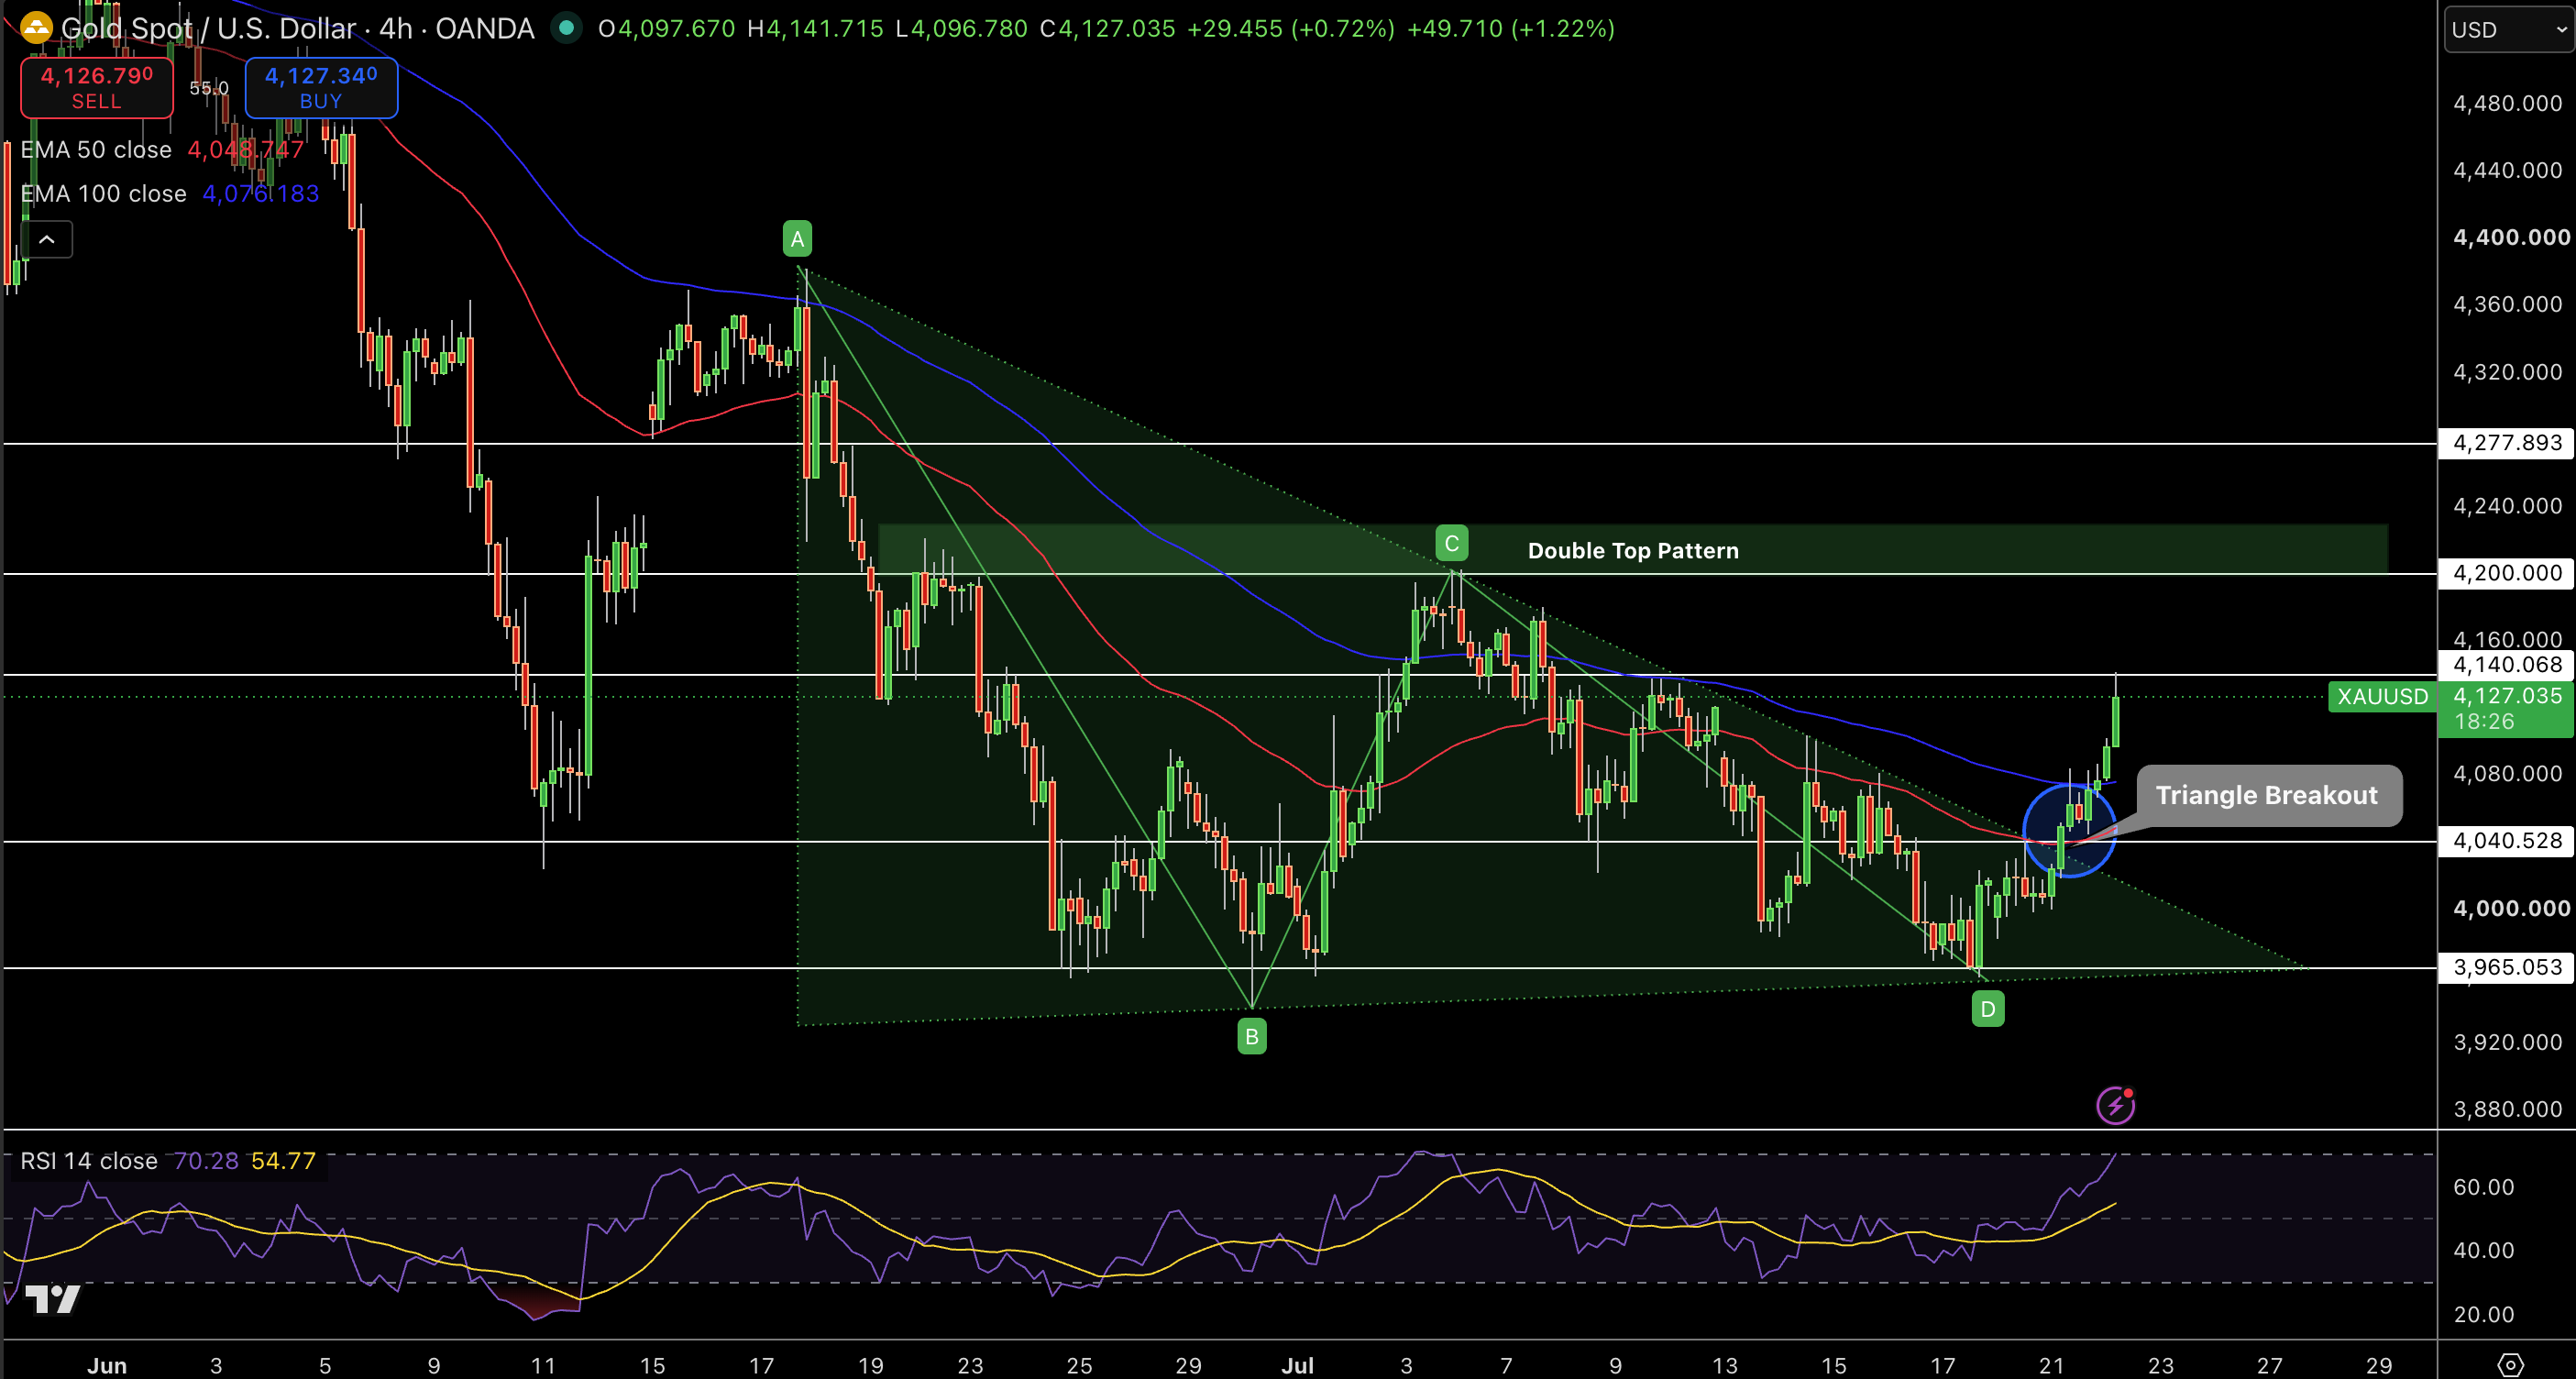
Gold managed to break above triangle resistance on the 4-hour chart, indicating a recovery for buyers over the short-term. XAU/USD now sits around the $4,127 level above the 50-EMA (at $4,049) and 100-EMA (at $4,076) following a strong impulsive move higher from the $3,965 support level. With the breakout, the recent bearish consolidation structure has been invalidated.
On the upside, key resistance lies in the $4,140 level, followed by the $4,200 round figure and then the $4,278 price level. Support is now expected near the $4,080 to $4,050 region, where the breakout took place, followed by the $4,040 level and then the $3,965 zone. The RSI has moved well above 70, implying strong bullish momentum in the market. This also suggests the market can consolidate for some time after the sharp price increase.
From my perspective, the triangle breakout confirms the bullish trend in the near term. Holding above $4,080 can keep the door open for another attempt higher, towards the $4,200 level. But a move back below the breakout region can result in a short-term pullback before buyers come back into the market.
Silver Technical Analysis: XAG/USD Clears Trendline Resistance, Momentum Turns Bullish
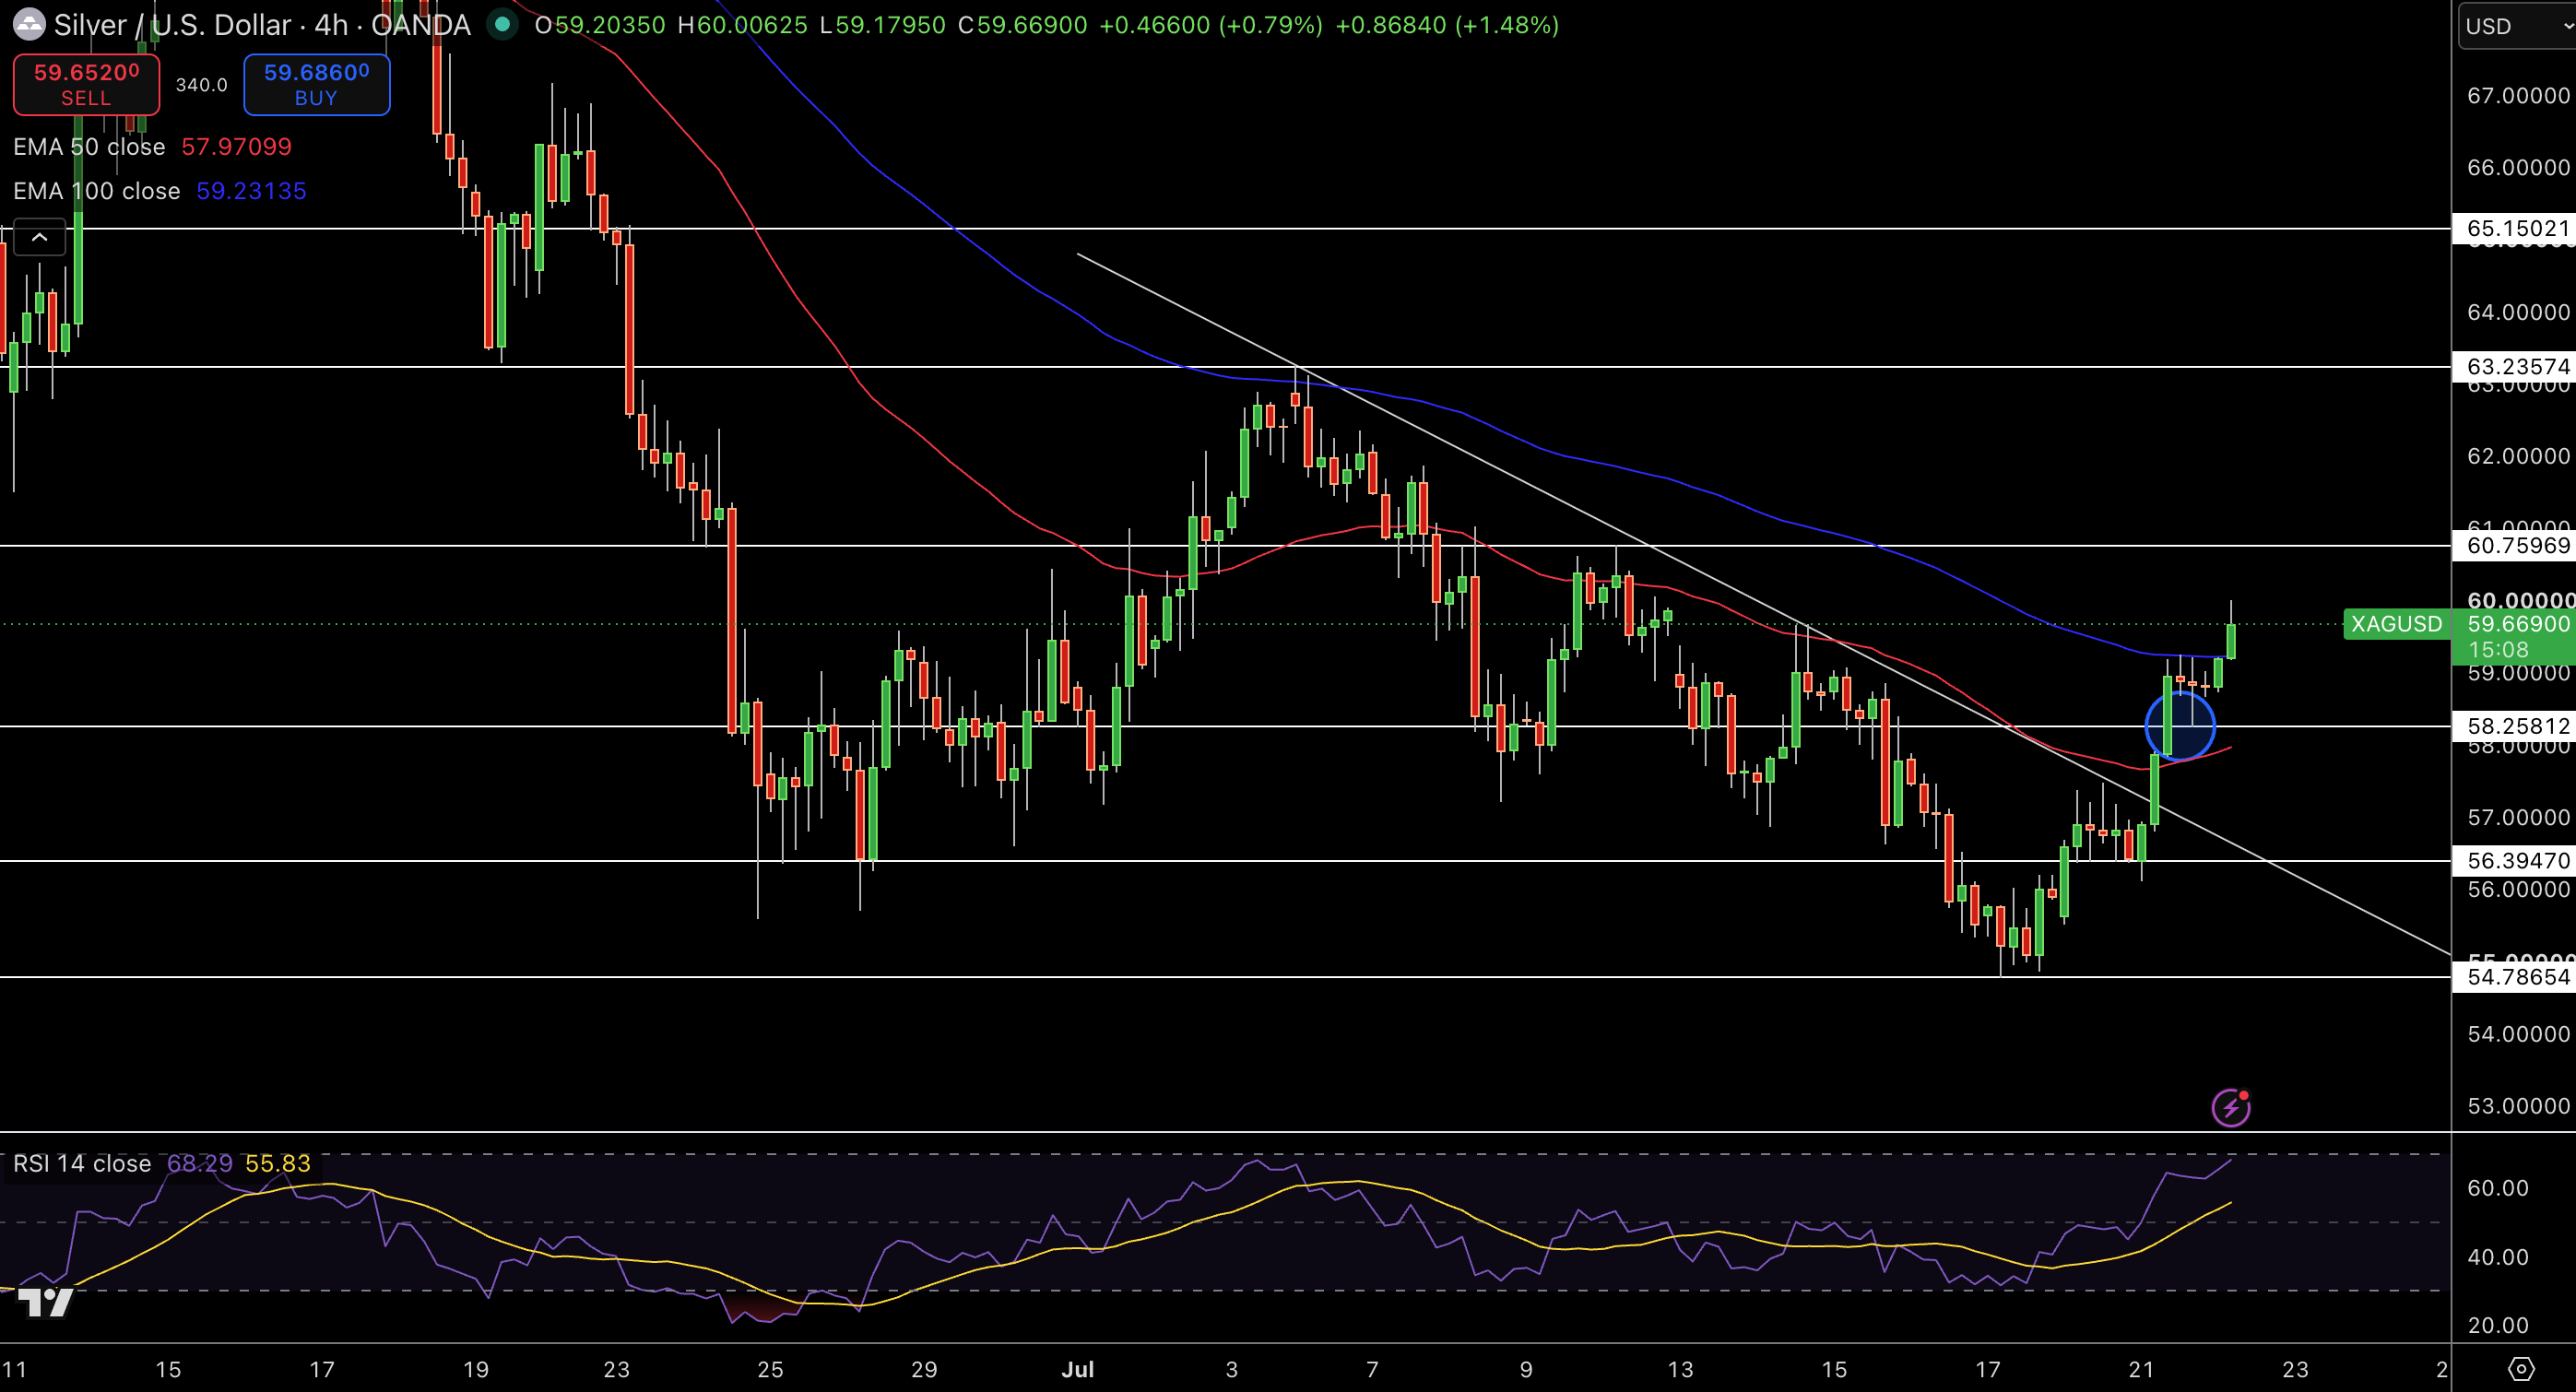
Silver has moved above descending trendline resistance on the 4-hour chart, which confirmed a change in momentum over the short-term. XAG/USD is currently trading around $59.67, sitting above the 50-EMA (at $57.97) and 100-EMA (at $59.23) as buyers are trying to extend the recovery from the recent lower lows recorded last week.
Gold Price Forecast
Every new Gold analysis as it publishes, today's technical signal and key levels, live price — on one page.
See all Gold forecastsKey resistance is expected at the $60.76 level followed by $63.24 and then $65.15. Support is now projected near the $59.23 level, while the immediate downside levels are seen at the $58.26 level and the $56.39 price level. The RSI has moved to around 68 in a strong bullish region, showing improving price momentum in the silver market.
As per my view, the break above the trendline confirms bullish momentum after several weeks of lower highs. Keeping prices above $59.20 should remain bullish and lead the market higher towards $60.76. However, a move below the 50-EMA and 100-EMA can result in some downside towards $58.26 before a continuation in the bullish direction.