



Dollar Index Outlook: Fed Hike Bets Rise as ECB Tightening and Inflation Risks Support EUR and GBP
The greenback remains caught in a cross-current of a more hawkish Fed and strong, rising currencies against the dollar, as traders await critical inflation data. A 60 percent chance of a Fed rate hike for the September 15-16 meeting emerged after a stronger-than-expected employment report on Friday. Now the focus is on U.S. inflation. A more hawkish reading will reinforce the need for the Fed to hike. The Fed’s Governor Waller noted that the next steps for the Fed will depend on upcoming trends for inflation.
The Dollar Index has struggled to move despite all this. A strong yen carry trade unwind due to market speculation of Bank of Japan (BoJ) tightening sent the dollar lower. An unwinding of yen-funded carry trades dominated the dollar, and heightened U.S. dollars, tensions in the Middle East are driving MENA currencies to further strengthen. The U.S. dollar will experience rising energy expenditures but so will other currencies.
Inflation concerns dominate the euro this week with the European Central Bank’s (ECB) meeting. All 65 economists in the Reuters poll expect the ECB to increase their deposit rate by 25 basis points to 2.50 percent. Inflation for the Eurozone jumped to 3.3 percent. High energy prices from the Iran conflict drive the inflation.
The discussion is turning to the possibility that September will only be the first in multiple hiking cycles. Deutsche Bank has already adjusted their forecast to include anticipating another hike in December.
Like many central banks, the Bank of England faces challenges with the energy crisis. Inflation risks returning mixed with weaker economies and already tighter financial conditions. Therefore, the Bank of England is likely to look at the energy crisis and global bonds and their corresponding yields to hopefully gain some insights into what their next moves should be. This means that sterling is going to be very volatile to the next set of Bank of England policy updates and how global markets react to those policies. Meanwhile, the greenback side of the GBP/USD will be under the control of the updates to U.S. inflation which will be available this week.
Fundamental bias: DXY neutral-to-bullish, EUR moderately bullish, GBP neutral-to-bullish.
U.S. Dollar Index Technical Analysis: DXY Remains Bearish Below 99.20 as 98.71 Support Comes Into View
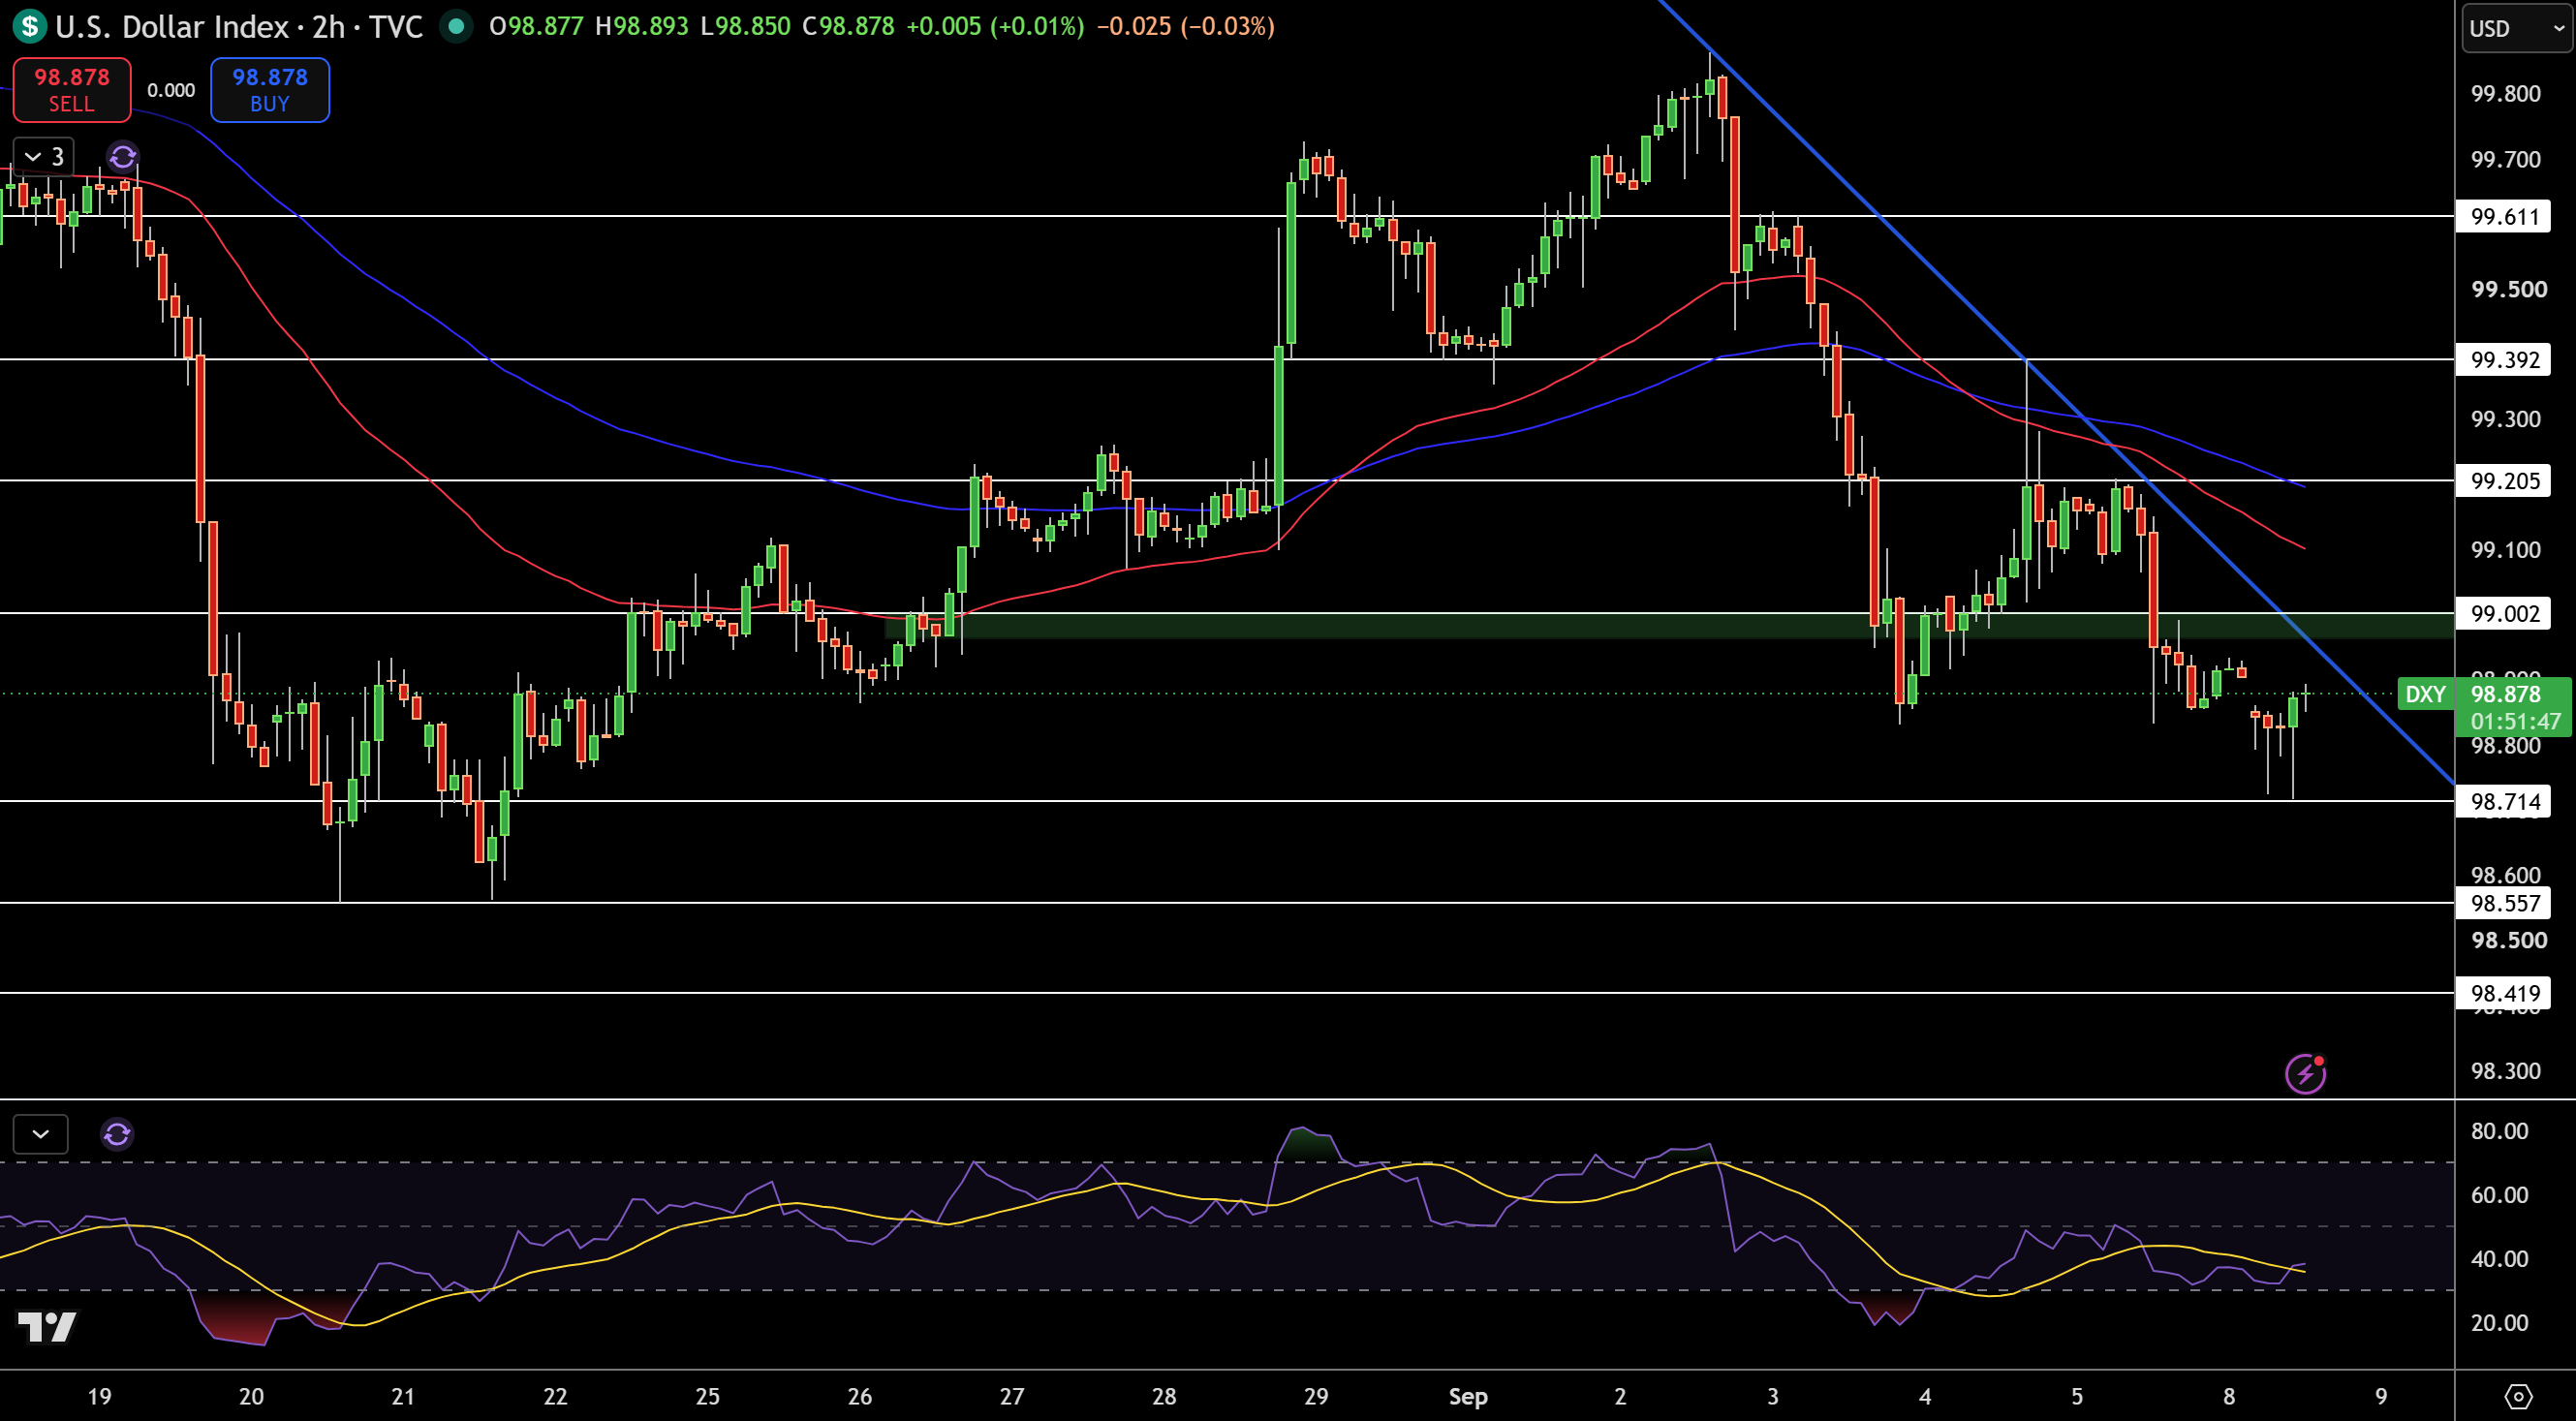
The U.S. Dollar Index is currently trading at 98.88 on the 2-hour chart. What is notable is the level of price that has consistently been trading below both moving averages and respecting the descending trendline from the early September high. The latest price action has also failed to trade back above the 99.00 – 99.20 region, which continues to maintain the bias lower on a short-term time frame.
The first support to watch is the 98.71 region and then the 98.56 and 98.42 regions. The 99.00 region is the first resistance area, with 99.20 and 99.39 above it. A recovery to the bias of the structure would require price to trade back above the 99.61 region.
The momentum as shown by RSI is still weak, with price trading below 99.20. I will maintain a bearish bias until price trades above 99.39 on a 2-hour time frame, then I will reassess.
EUR/USD Price Forecast
Every new EUR/USD analysis as it publishes, today's technical signal and key levels, live price — on one page.
See all EUR/USD forecastsGBP/USD Technical Analysis: Sterling Stays Trapped Between 1.3477 Support and 1.3530 Resistance
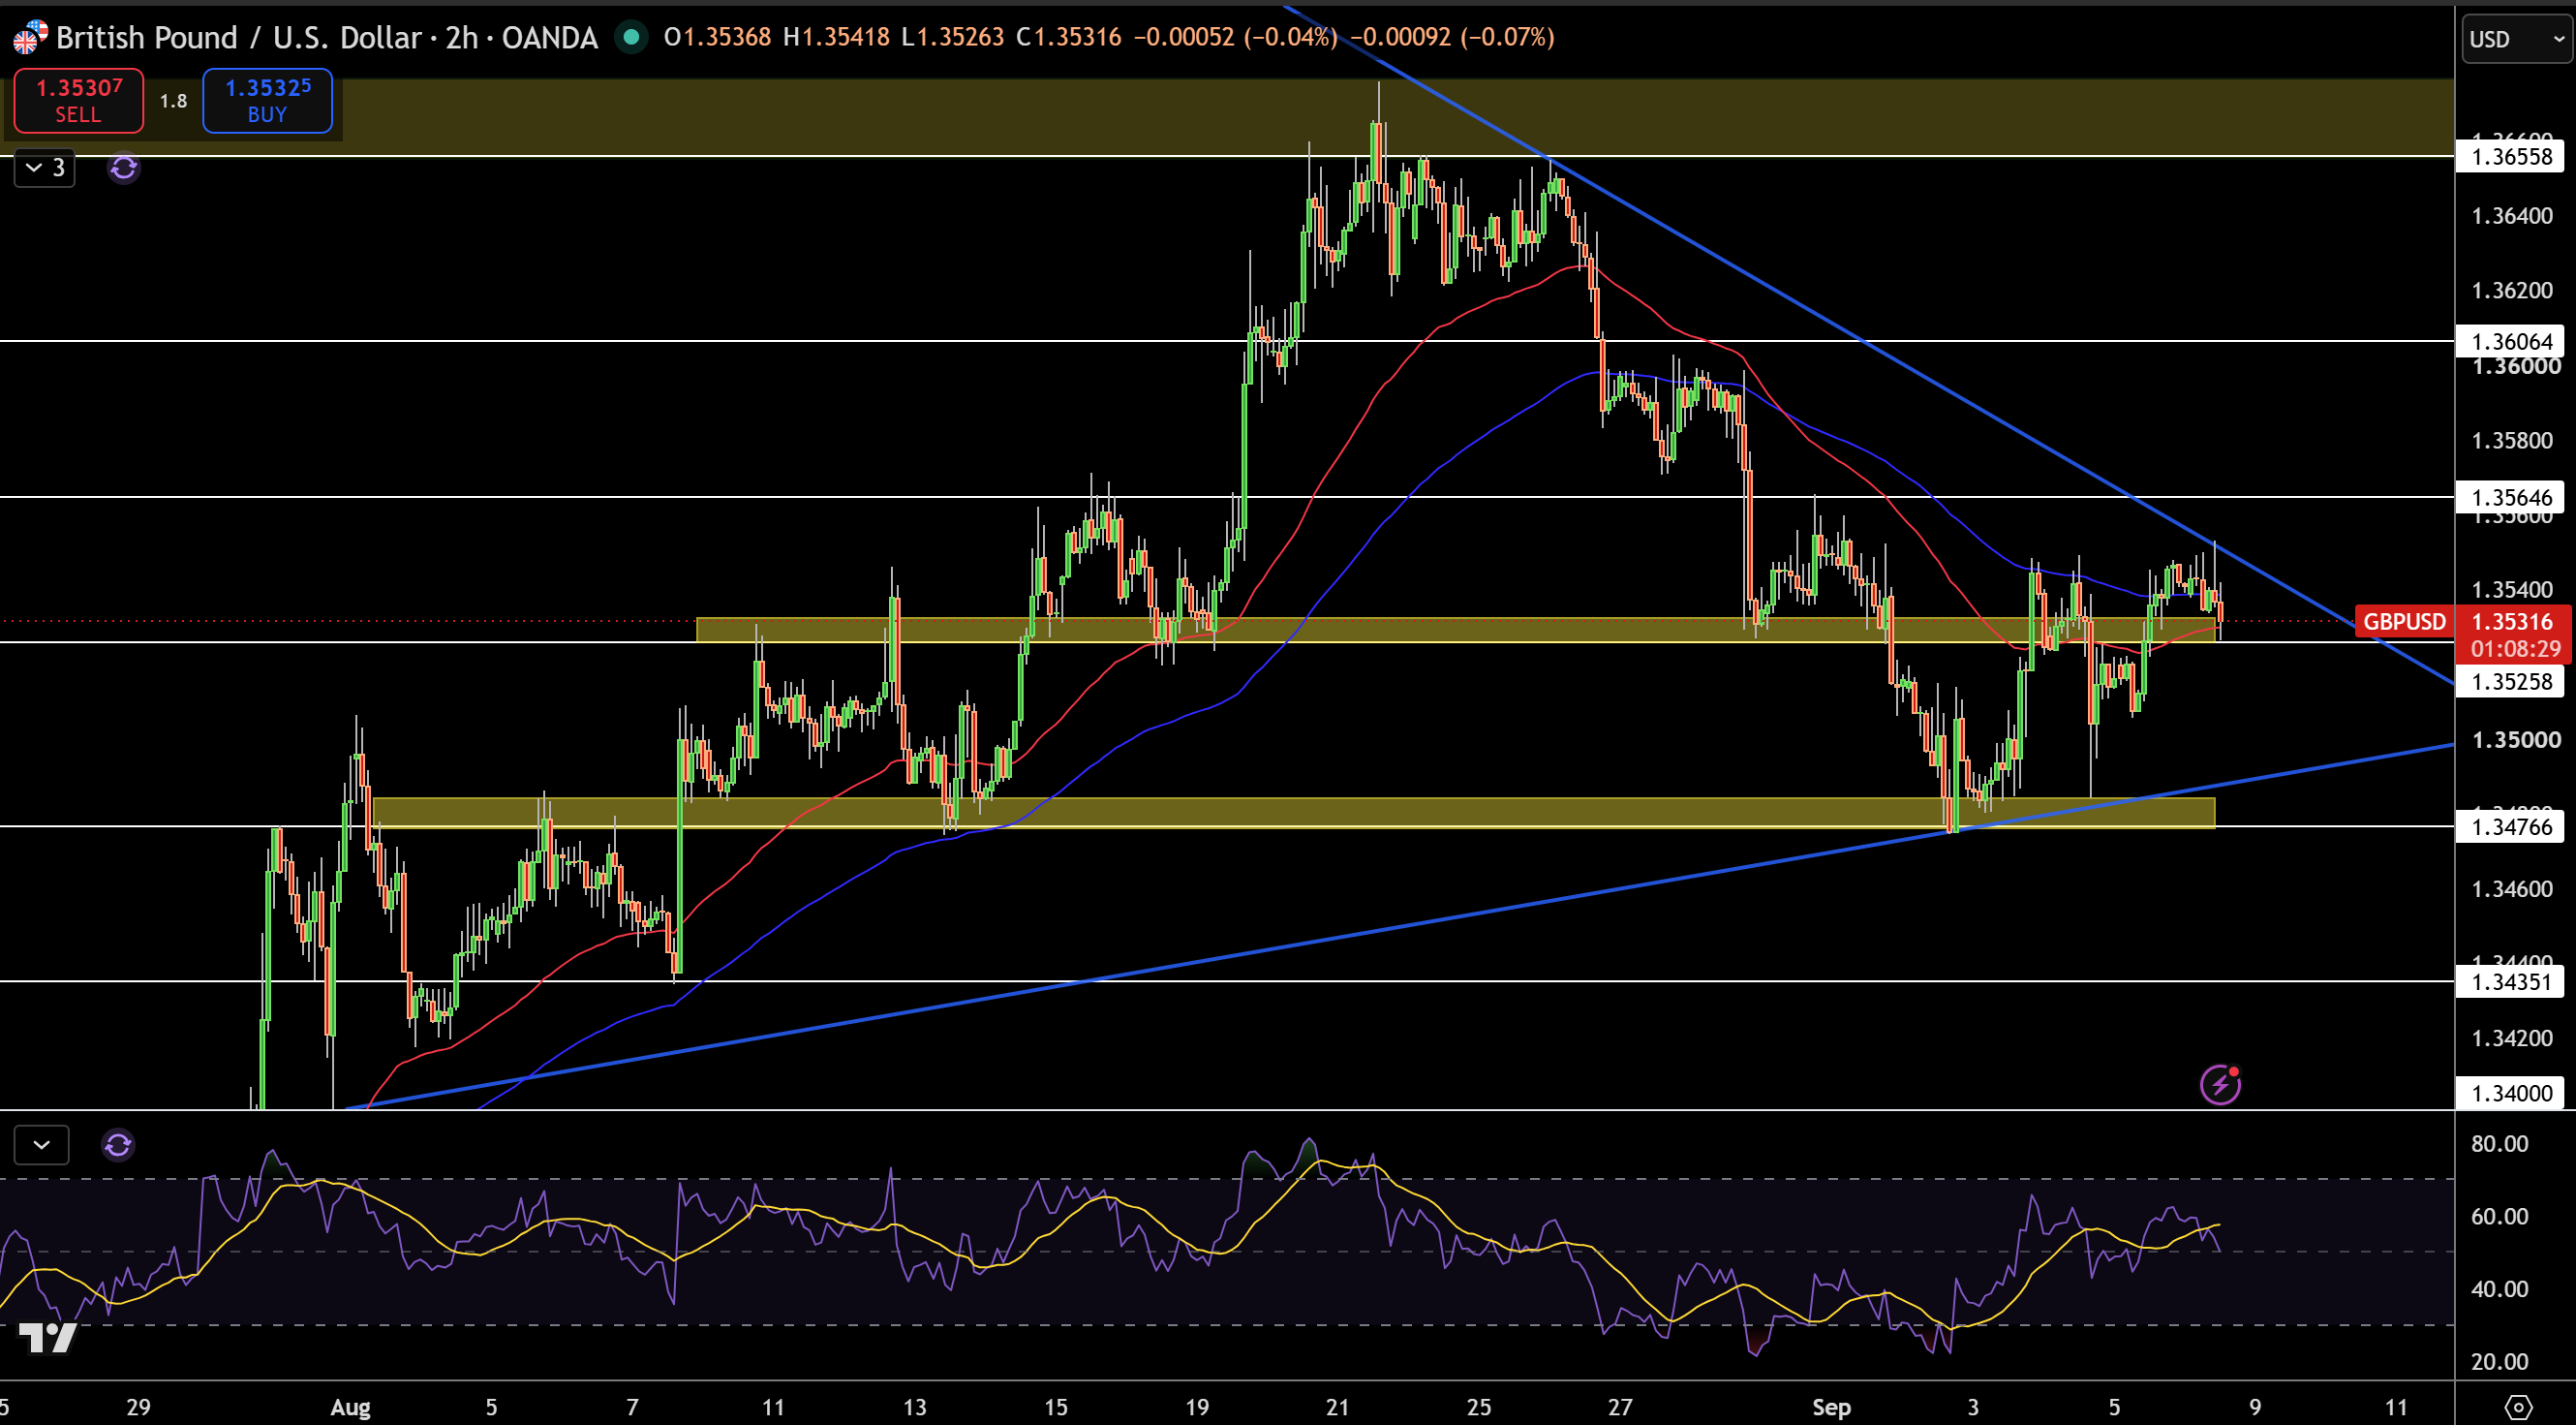
Currently, GBP/USD is trading at the 1.3530 level on the 2-hour chart after a rebound from the 1.3477 support area. Buyers have been defending the rising trendline and the lower demand area, but the pair has been unable to break above the descending trendline and resistance band located between 1.3530 and 1.3540.
1.3540 is the first resistance area, followed by 1.3565 and 1.3606. On the other hand, key support levels remain at 1.3477 with additional support found at 1.3435.
RSI is sitting neutral mid-range, indicating that there is no clear direction from the market and traders are waiting for direction. I am neutral to slightly bearish while GBP/USD is trading below resistance at the 1.3540 to 1.3565 area. Above the 1.3565 resistance, I would be bullish and if it breaks the 1.3477 support then I would be bearish.
EUR/USD Technical Analysis: Euro Compresses Inside Triangle as 1.1639 Becomes the Breakout Trigger
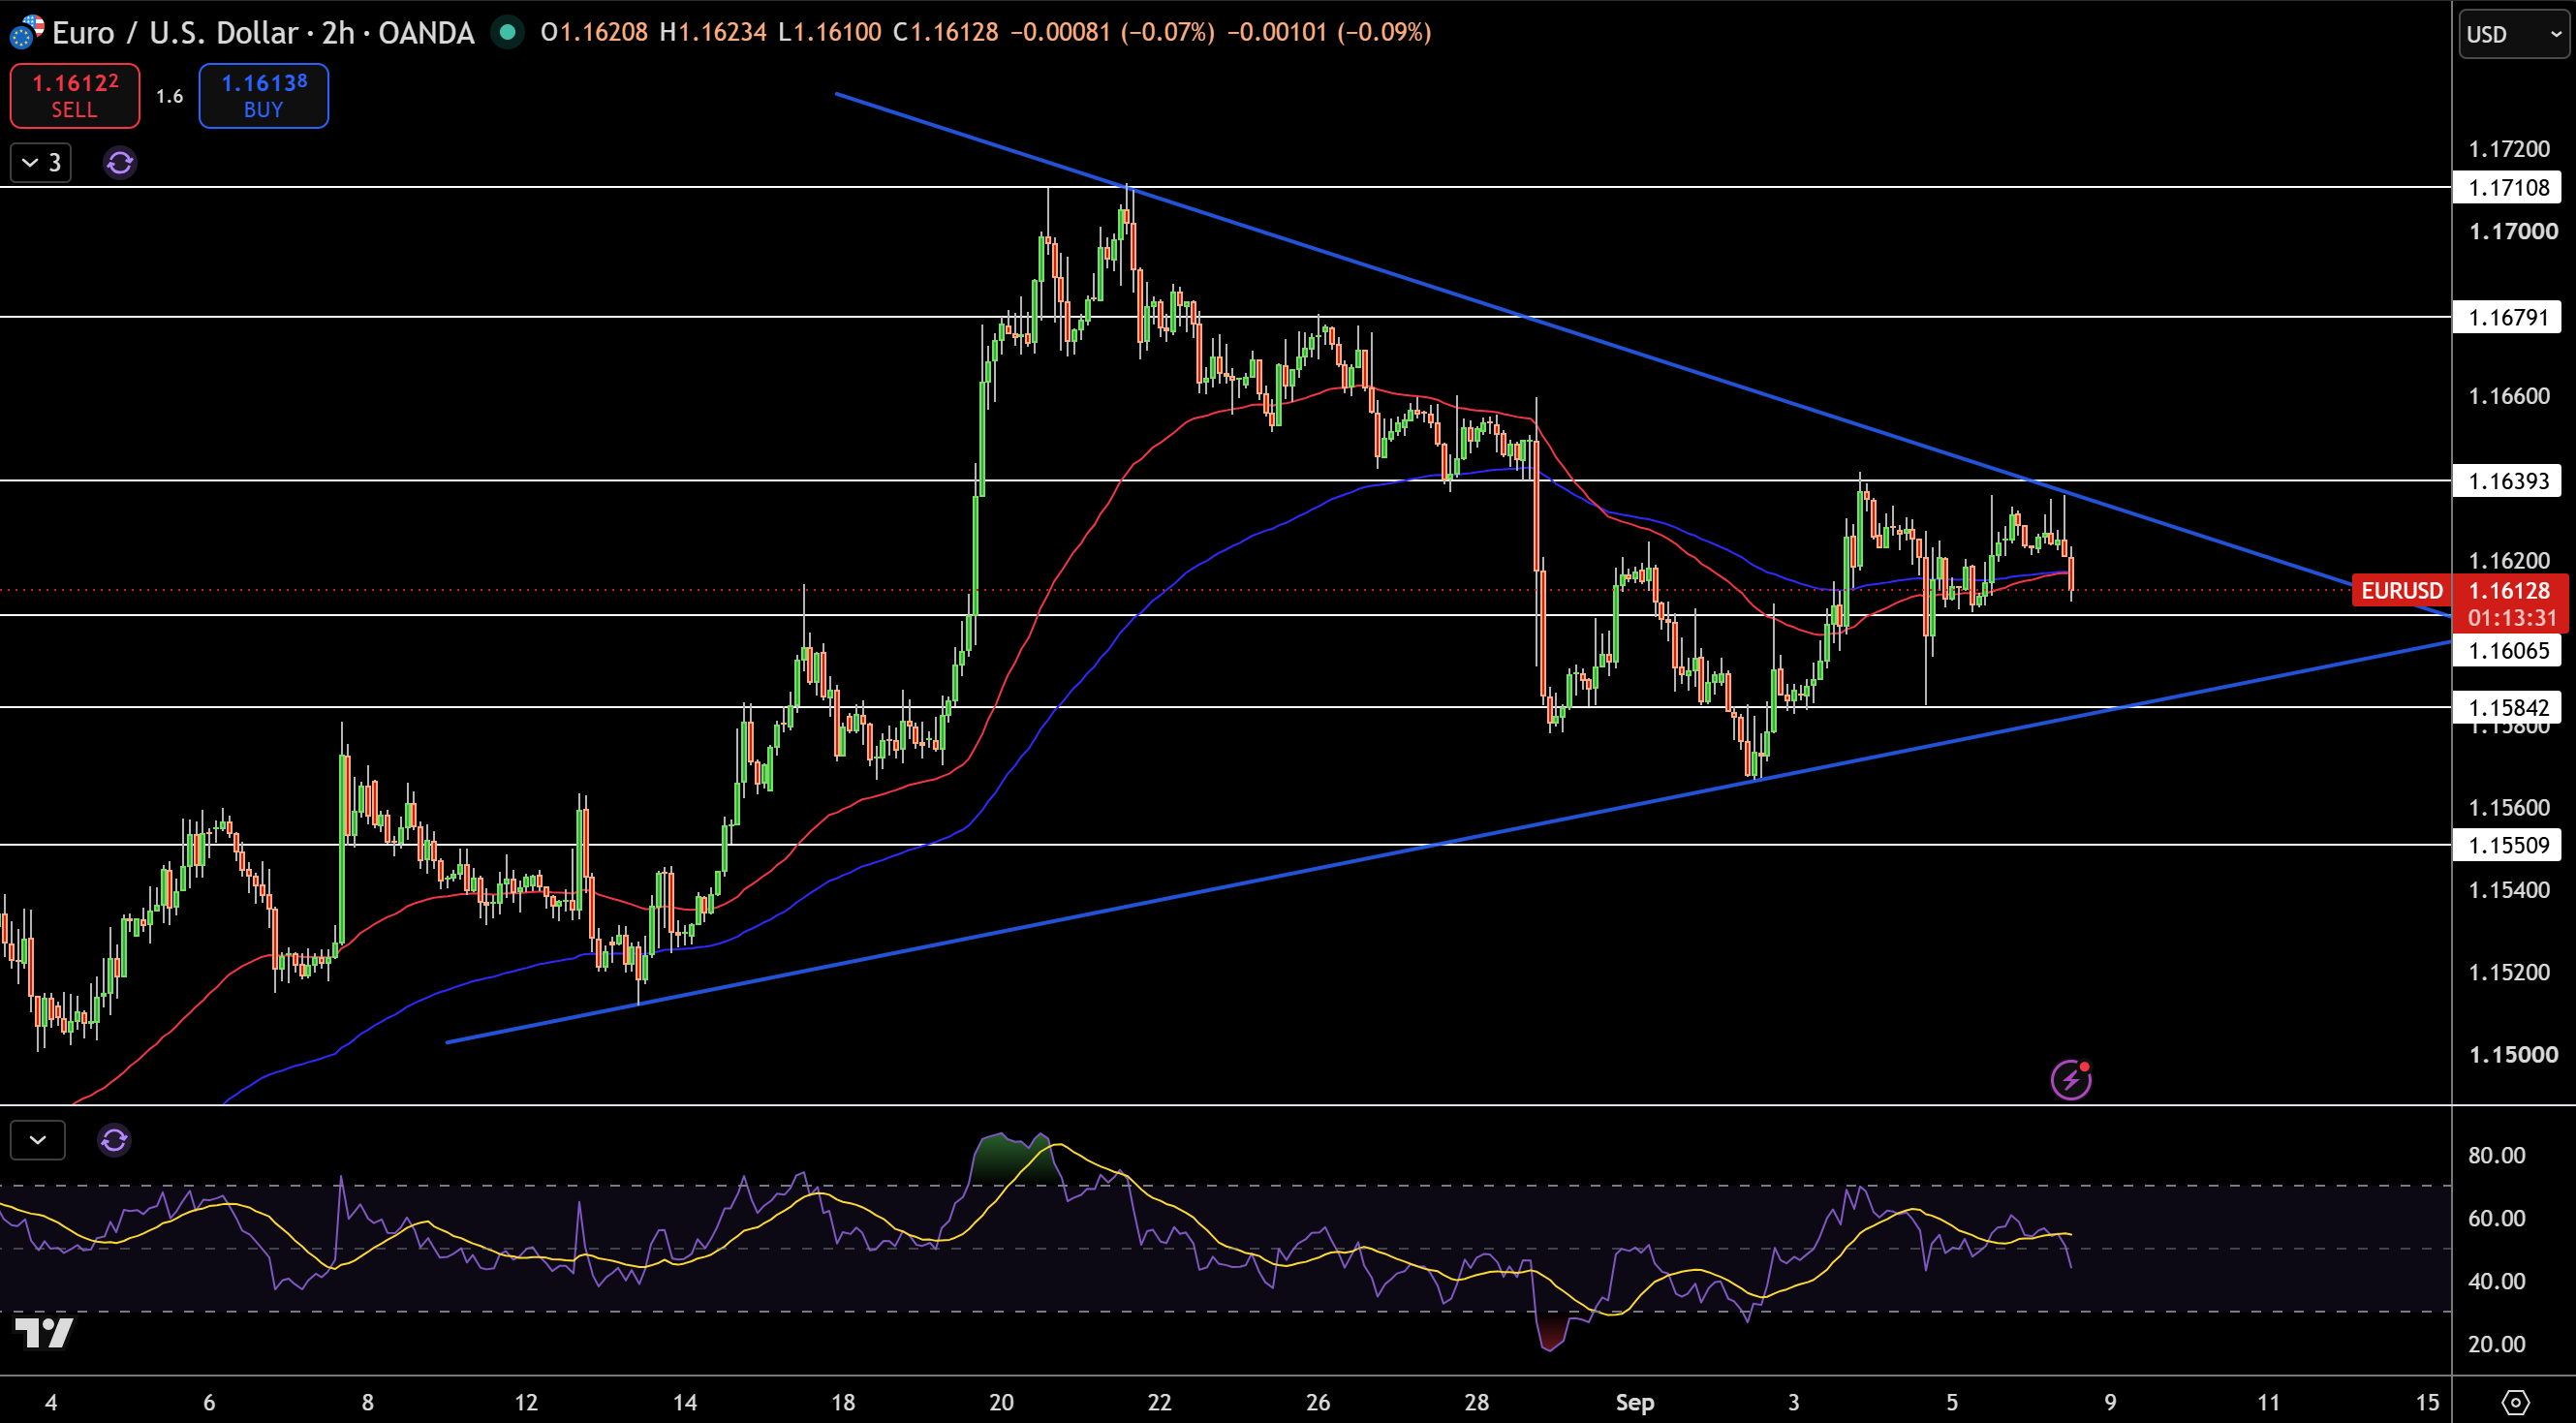
EUR/USD is currently trading at 1.1613 on the 2-hour chart. The structure has compressed significantly within a descending triangle. There is a trading range that is defined by the descending trendline from the August highs and the rising support line below the price. What this means is that price is trading in a range rather than providing us a clean trading range.
Roughly around 1.1639, 1.1679, and 1.1711 are immediate resistance levels. On the other hand, 1.1607 is the initial support level, with 1.1584 and 1.1571 as more significant levels.
RSI is near neutral, which supports the consolidation. This is a neutral spot for me, but if price neatly clears 1.1639 and stays above the descending trend line, then I will become more bullish. A break below 1.1584 will put me in a bearish bias with 1.1571 as the focus level.