



Dollar Index Outlook: Strong U.S. Jobs Revive Fed Hike Bets as ECB and BoE Tightening Risks Rise
The dollar begins the new week with stronger Federal Reserve tightening expectations after Friday’s U.S. employment report showed the labor market remains considerably more resilient than economists anticipated. Employers added 162,000 jobs in August, the strongest increase in five months, while unemployment held at 4.1%. Wage growth eased slightly to 3.1% annually, limiting evidence of a fresh wage-driven inflation problem, but the employment rebound was strong enough to reopen the debate over another Fed increase.
Markets now assign roughly a 57% probability of a Fed rate increase in September, compared with less than 50% before the payrolls report. Yet the Dollar Index has received only limited fundamental support. Investors are increasingly considering the possibility that the same Iran-driven energy shock pushing U.S. inflation higher could force other major central banks to tighten as well, limiting any expansion in America’s relative yield advantage. U.S. markets are closed Monday for Labor Day, leaving trading conditions comparatively subdued ahead of this week’s PPI and CPI reports.
For the euro, attention has shifted squarely to Thursday’s European Central Bank decision. Economists overwhelmingly expect a 25-basis-point increase, taking the deposit rate to 2.50%, after eurozone inflation accelerated to 3.3%. Deutsche Bank on Monday went further, forecasting another increase in December because sustained energy inflation could make the current tightening cycle longer than previously expected.
Sterling faces a similar inflation-versus-growth dilemma. Bank of England Chief Economist Huw Pill has argued that raising rates sooner could prevent the Iran-related energy shock from becoming embedded in domestic inflation. At the same time, Britain’s elevated borrowing costs and fiscal pressures ahead of the October 28 budget remain a vulnerability for the pound.
Fundamental bias: DXY neutral-to-bullish, EUR moderately bullish, GBP neutral-to-bullish.
U.S. Dollar Index Technical Analysis: DXY Stalls at 99.08 as 98.83 Support Comes Back Into Focus
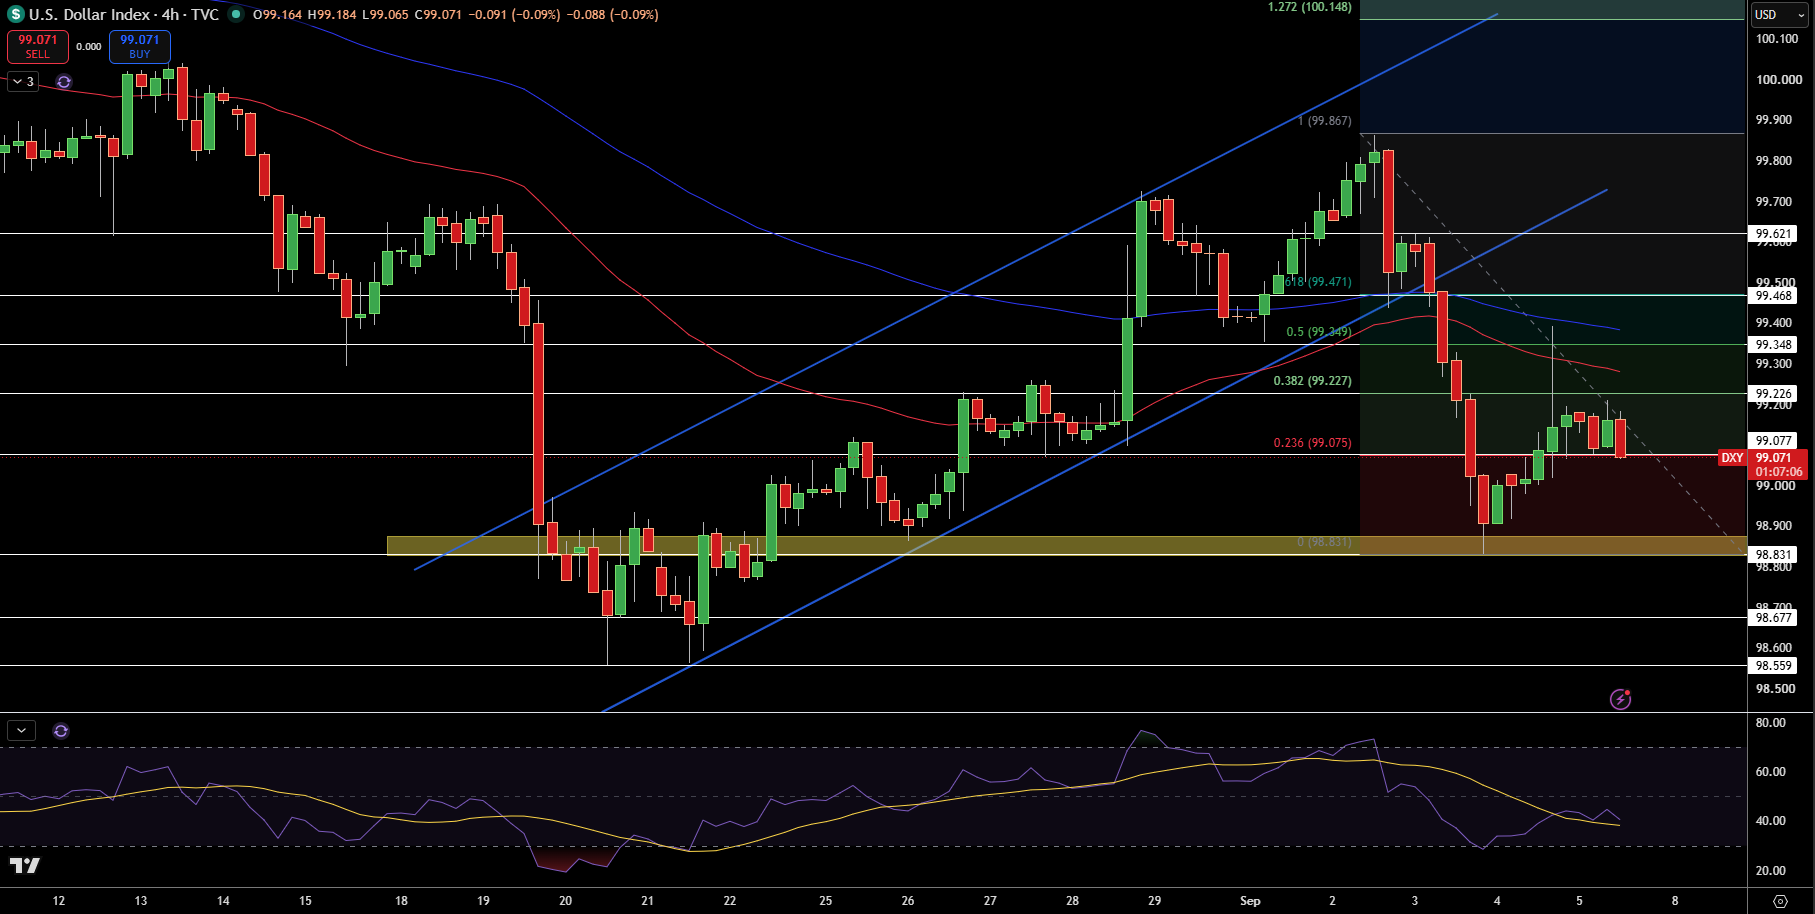
The U.S. Dollar Index is currently at 99.07 on the 4-hour chart as price fails to advance beyond the 98.83 support area, where price recovery started to stall at the 99.08 level, almost exactly at the 23.6% Fibonacci level. Price is also below the 50-EMA, 100-EMA and the broken rising channel, suggesting the short-term structure remains weak.
The first support level to watch for is 98.83, and a clear break below 98.83 would expose the 98.68 and 98.56 levels. Resistance levels are located at 99.08 and above that at 99.23, 99.35 and 99.47.
Until RSI rises above the midline to signal a reversal, price appears to be bearish focusing on DXY staying below the 99.23 and 99.35 levels. A 4-hour close above 99.47 would be needed to change this bearish focus, but for now I view this price action as a corrective bounce.
EUR/USD Price Forecast
Every new EUR/USD analysis as it publishes, today's technical signal and key levels, live price — on one page.
See all EUR/USD forecastsGBP/USD Technical Analysis: Sterling Rebounds From 1.3477 but 1.3526–1.3565 Still Defines the Ceiling
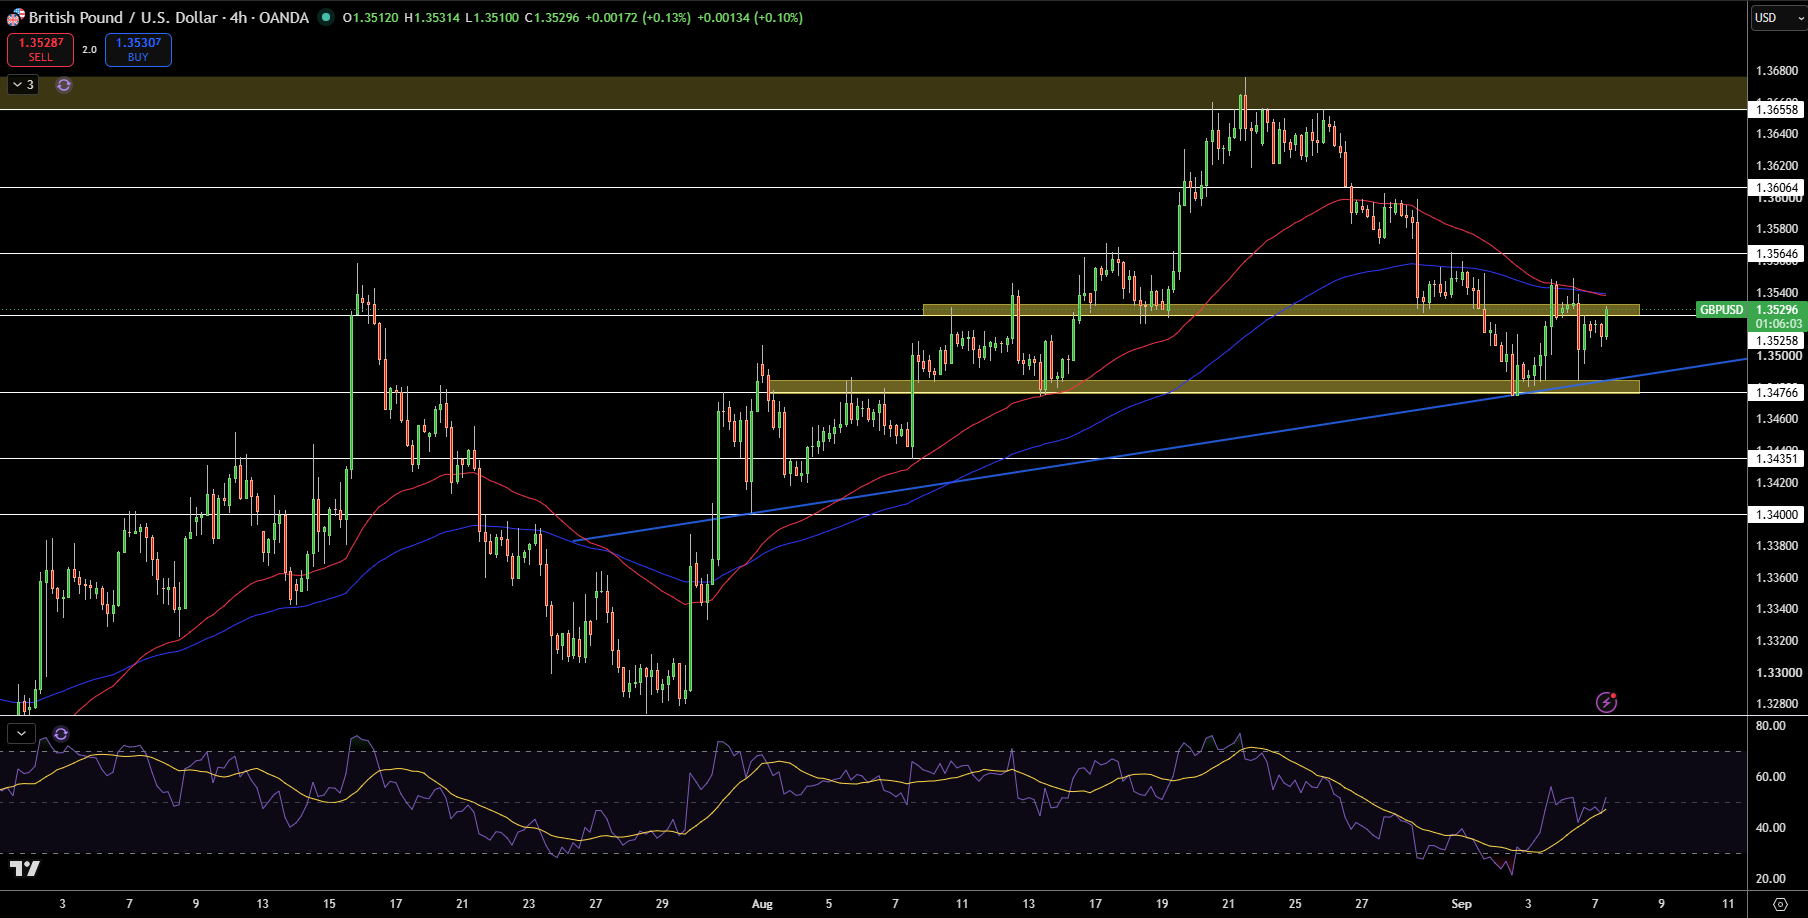
GBP/USD is currently trading at 1.3530 on the 4 hour chart after another recovery from the 1.3477 support zone. The rising trend line under the price is being defended by the buyers. However, it is still struggling to redefine resistance at 1.3526 to 1.3565 and is below both moving averages.
The first resistance level is around 1.3526 to 1.3540, before which is 1.3565, and above that level is a large supply zone at 1.3656 to 1.3676. Looking at the support side, 1.3477 is a key level and below that is 1.3435 and 1.3400.
RSI is recovering from oversold territory, which supports the bounce, but I still can’t consider this a large bounce. Until GBP/USD closes above 1.3565, I will maintain a neutral-to-bearish outlook. A break below 1.3477 would confirm a new trend of lower prices.
EUR/USD Technical Analysis: Euro Holds 1.1600 but Descending Trendline Still Caps the Recovery
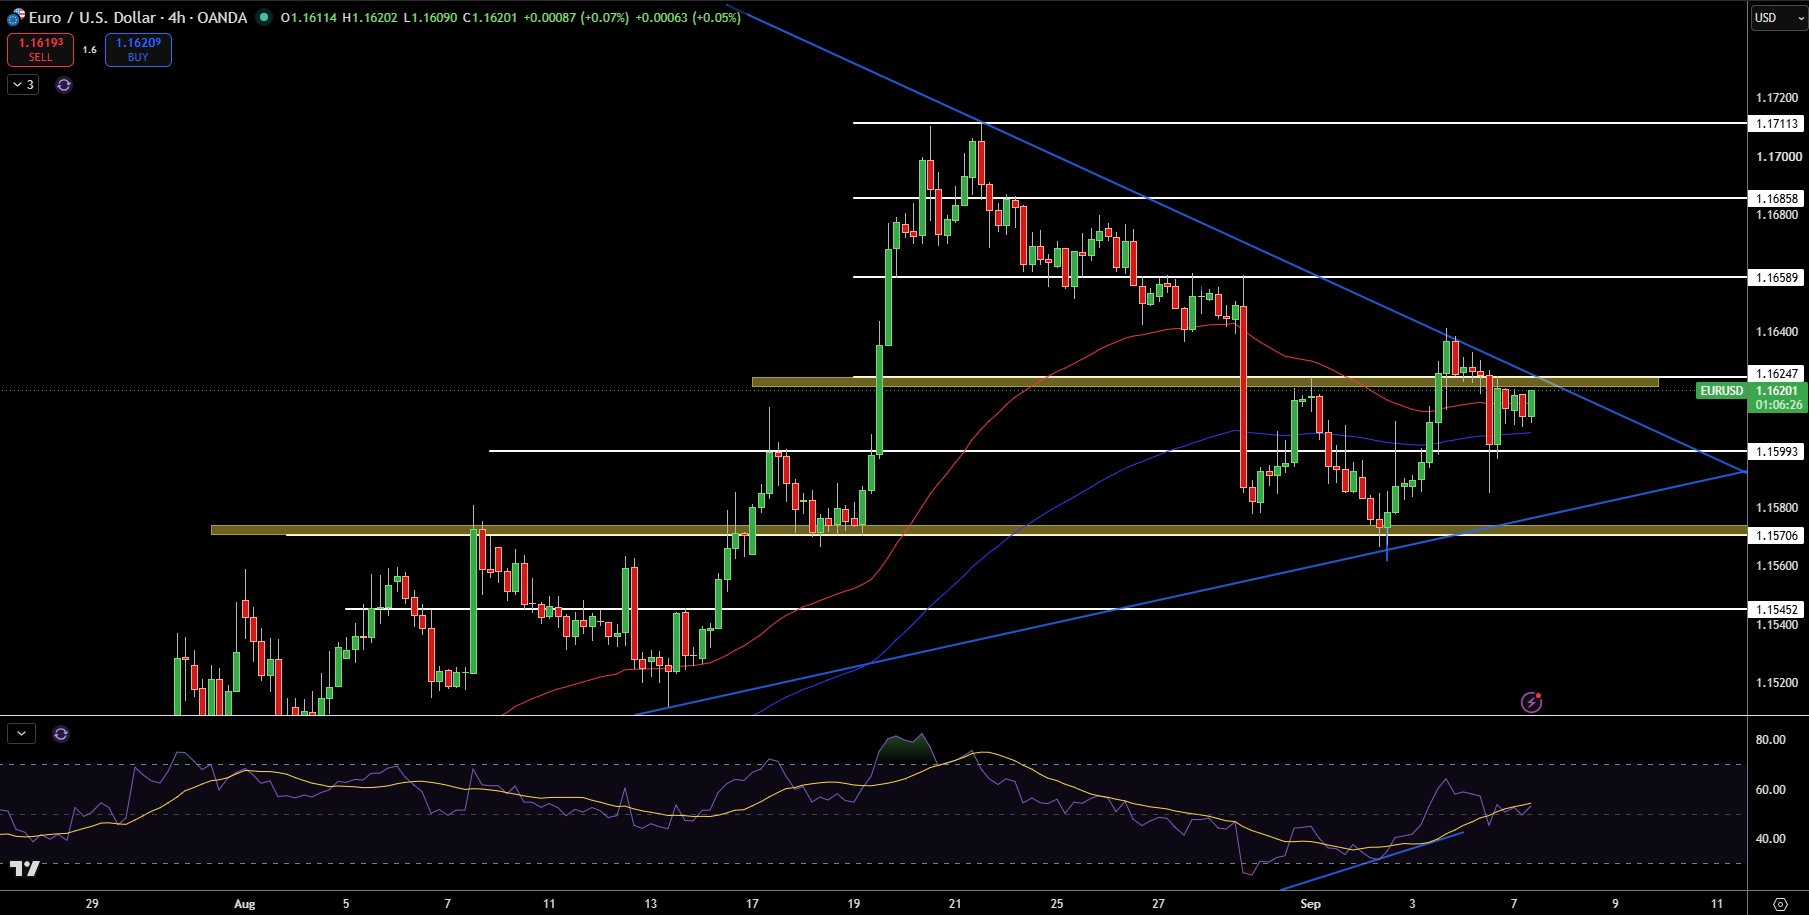
EUR/USD is currently at 1.1620 on the 4-hour chart as price rebounded from the 1.1571 support zone. Currently, price has recovered above the 100-EMA, and is now testing the resistance of 1.1625, but the dominant trend is controlled by the descending trendline from the August highs.
Immediate resistance levels are at 1.1625, 1.1659, 1.1686 and 1.1711. First of the support levels is at 1.1599, then 1.1571 and 1.1545 in the 1.15 zone.
RSI is recovering which shows upward momentum, but has not given us a bear trend signal, so I remain neutral with a bearish bias on EUR/USD holding 1.1599. If we fall below 1.1571 I will change my view and become neutral. A higher close that breaks the trendline and the resistance level at 1.1625, would give me the confirmation to sell aiming for 1.1659 and higher.