



Gold & Silver News: Strong U.S. Jobs Revive Fed Hike Risk as Inflation Data Becomes Next Test
After a strong U.S. job report, gold and silver resumed the week under pressure from monetary policy. Higher job numbers suggested the Federal Reserve might opt for a rate hike in September. Friday’s report indicated that the U.S. hired 162,000 jobs, significantly more than predicted, and that unemployment was steady at 4.1 percent with a growing workforce. A growing monetary policy also became more palatable given the report.
The Fed now has a 58 percent chance of a September rate hike according to market predictions. Because of last week’s dovish repricing, Governor Waller significantly adjusted his rate hike position as he indicated that he would keep rates steady if he continued to see downward trends on inflation. For ( non-yielding ) precious metals, the largest concern remains the possibility of higher interest rates and higher Treasury yields.
The focus is now on this week’s U.S. inflation reports. With producer prices scheduled for Thursday and CPI for Friday, strong inflation reports could certainly push the Fed to act in September.
Despite heightened tensions with Iran, gold’s safe-haven status is weak considering the growth in monetary policy.
Gold buying keeps growingly with new purchases by the People’s Bank of China and Poland.
Silver is in the same position as gold but has unique longer-term fundamentals. The silver market is expected to have a sixth consecutive year of structural deficits in 2026. Solar industry players are some of the more active players in trying to use less silver to negate the cost of silver as it has been increasingly high.
Fundamental bias: Near term neutral-to-bearish for gold and silver. U.S. CPI and PPI are now the main catalysts.
Gold Technical Analysis: XAU/USD Rejected Below $4,465 as $4,365 Support Comes Back Into Focus
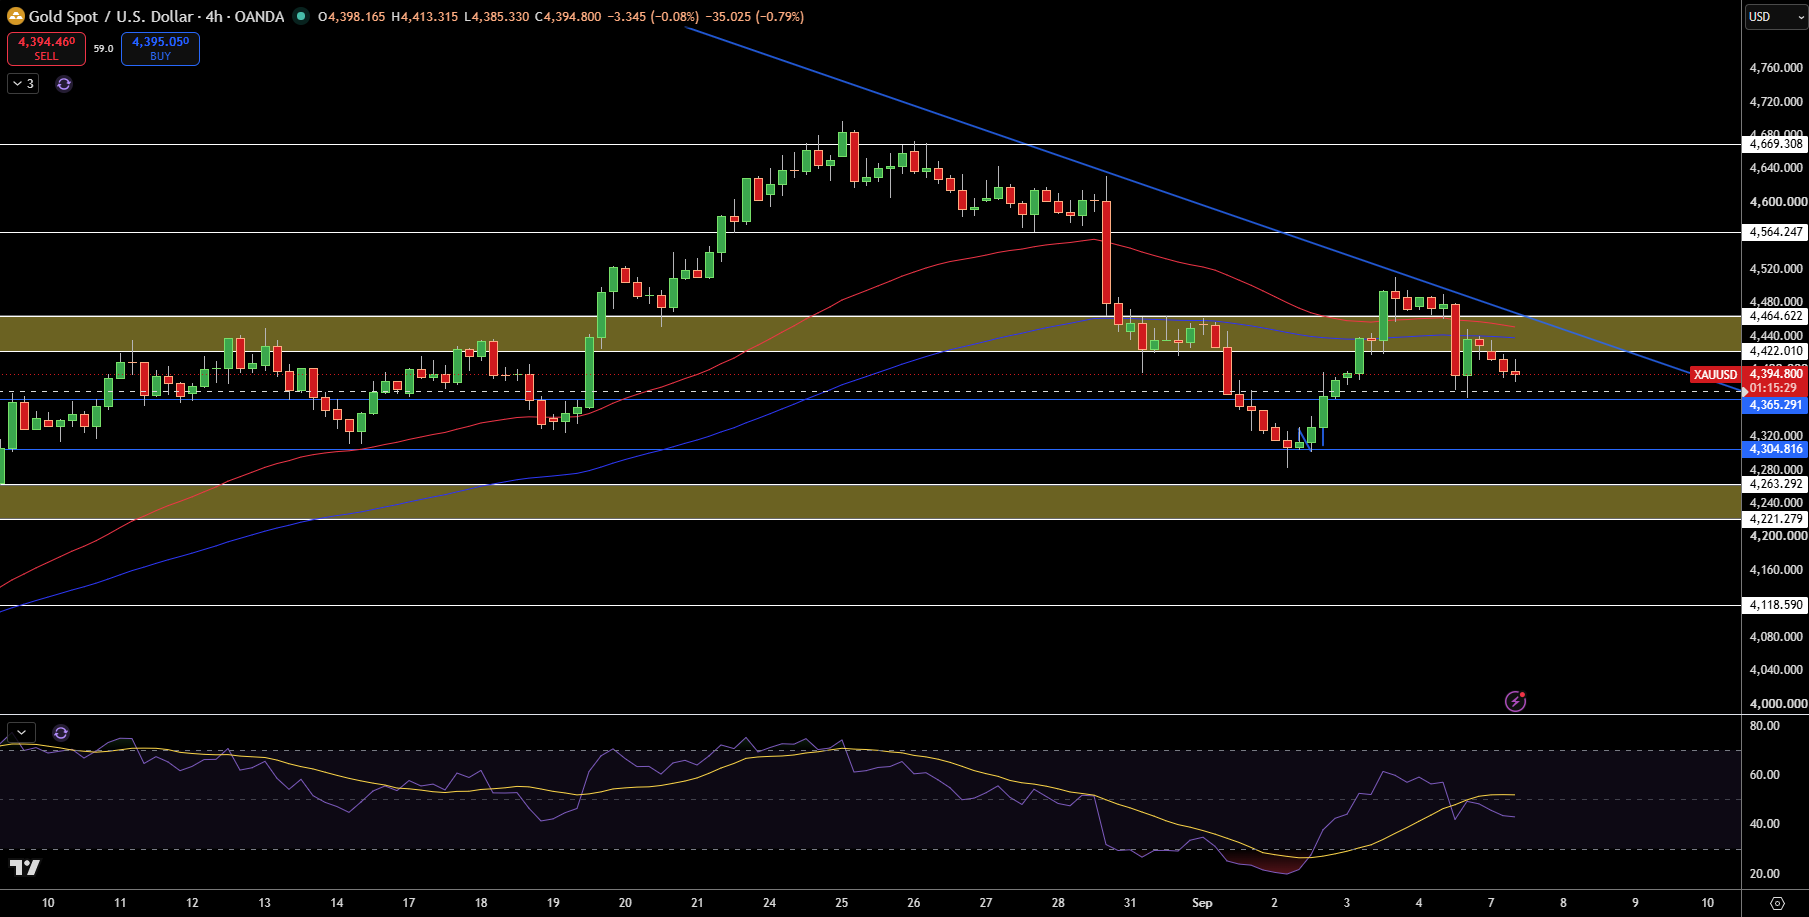
Gold is trading at $4,395, down from the rejection of the $4,422 to $4,465 resistance zone on the 4-hour chart. I’m watching the $4,304 level, from which a strong recovery occurred. however, the recovery stalled just under the resistance zone formed by the descending trendline. This shows the overall bearish bias is still intact.
The first level of support is at $4,365. This level, if broken, will result in a drop to $4,305 and then $4,263 to $4,221. Conversely $4,422 is the first zone of resistance, with $4,465 and $4,564 above that.
A rebound from $4,365 would be a bull flag and indicate the continuation of the bearish trend below $4,465. A break above the $4,465 resistance would be a positive sign for the bullish trend.
Gold Price Forecast
Every new Gold analysis as it publishes, today's technical signal and key levels, live price — on one page.
See all Gold forecastsSilver Technical Analysis: XAG/USD Rejected at $67.21 as $65.26 Support Faces Another Test
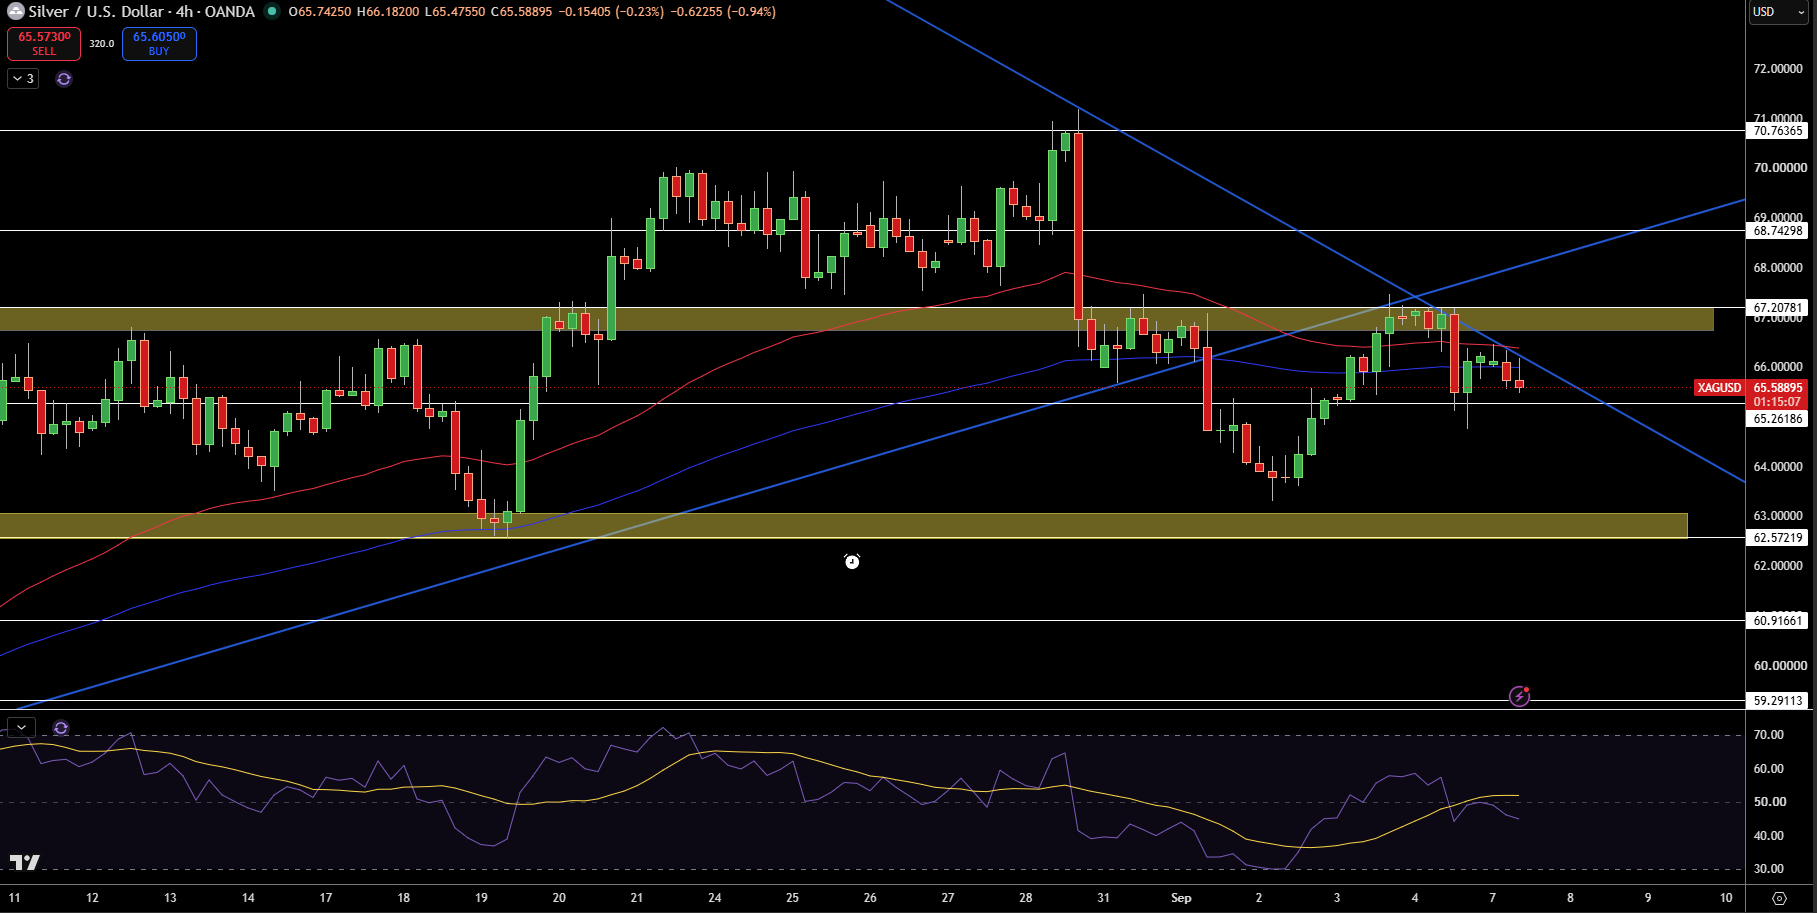
Silver is currently trading at $65.59 on the 4-hour chart, following the rejection of the $67.21 resistance zone. This zone is also a descending trendline that acted as prior support along with the short term moving averages all acting as resistance on the confluence zone.
This makes the pullback more meaningful (and downside) versus what is usually considered an intraday pullback.
The immediate support is $65.26. If sellers drive price below, I would focus on $63.00-62.57 which remain key support levels in the broader picture. Key levels to the upside are $67.21, then $68.74 and $70.76.
RSI has moved from being neutral to bearish, and is potentially rolling over on the lower end of it’s range. I am still bearish below $67.21, and that level needs to be cleared for this setup to be invalidated. A clear break above that level would open a run towards $68.74, however until then I will focus on the current levels of $65.26 and $62.57.