


August Rally Sets Up Critical Pullback
Voyager Technologies, Inc. (VOYG) is showing signs that it may have reached a bottom for its first pullback following a sharp advance in August. The company is a U.S. defense and space technology company focused on mission-critical systems. It reported Q2 2026 earnings after the market closed on August 26. The report was followed by an approximately 62% rally to a high of $45.40 in only nine days, with volume rising above average levels during the strong momentum days.
During the advance, strength was confirmed by a reclaim of the 50-day moving average and a bullish reversal signal that occurred when VOYG rose above the lower swing high from July at $36.92. That combination of momentum and technical confirmation now provides an important backdrop for assessing whether the pullback has found support.
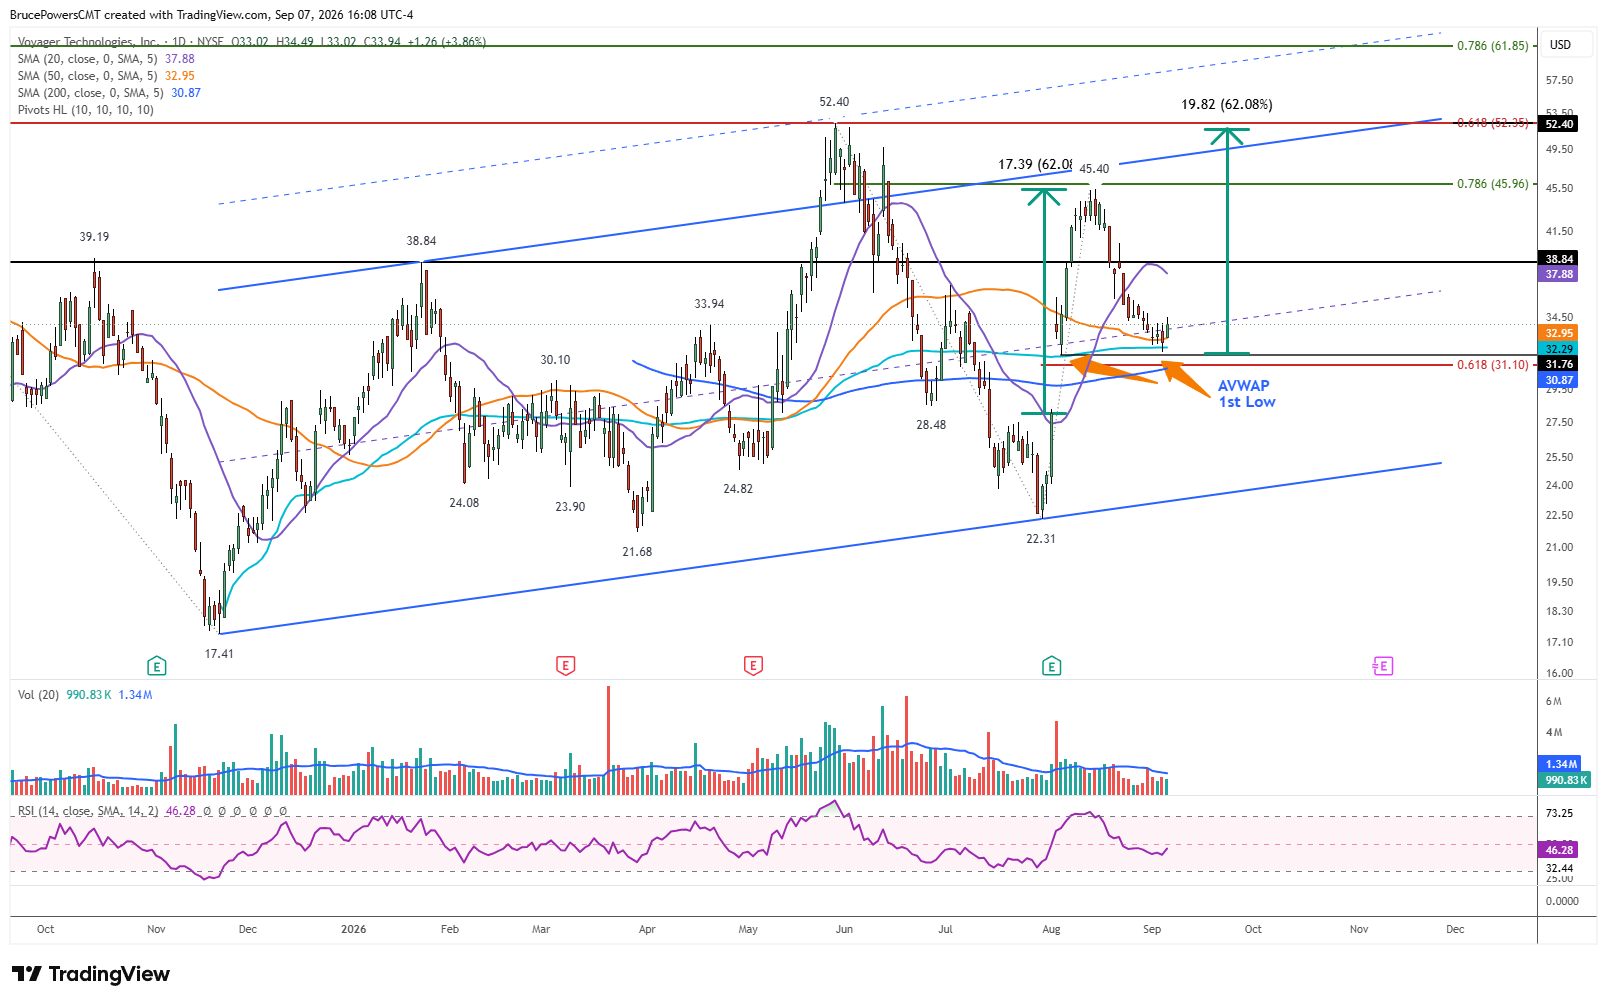
Support Confluence Puts Bottom to the Test
A pullback followed the $45.40 high to a low of $31.96 last week, reaching an initial support confluence zone that may attract buyers and lead to a continuation of the initial August advance. The low formed within a support confluence zone defined by the 50-day moving average and an anchored volume-weighted average price (AVWAP) level anchored to the record low of $17.41 reached in November 2025, following its IPO in June. A successful test of this zone would strengthen the case that the pullback has established a higher low within the developing uptrend.
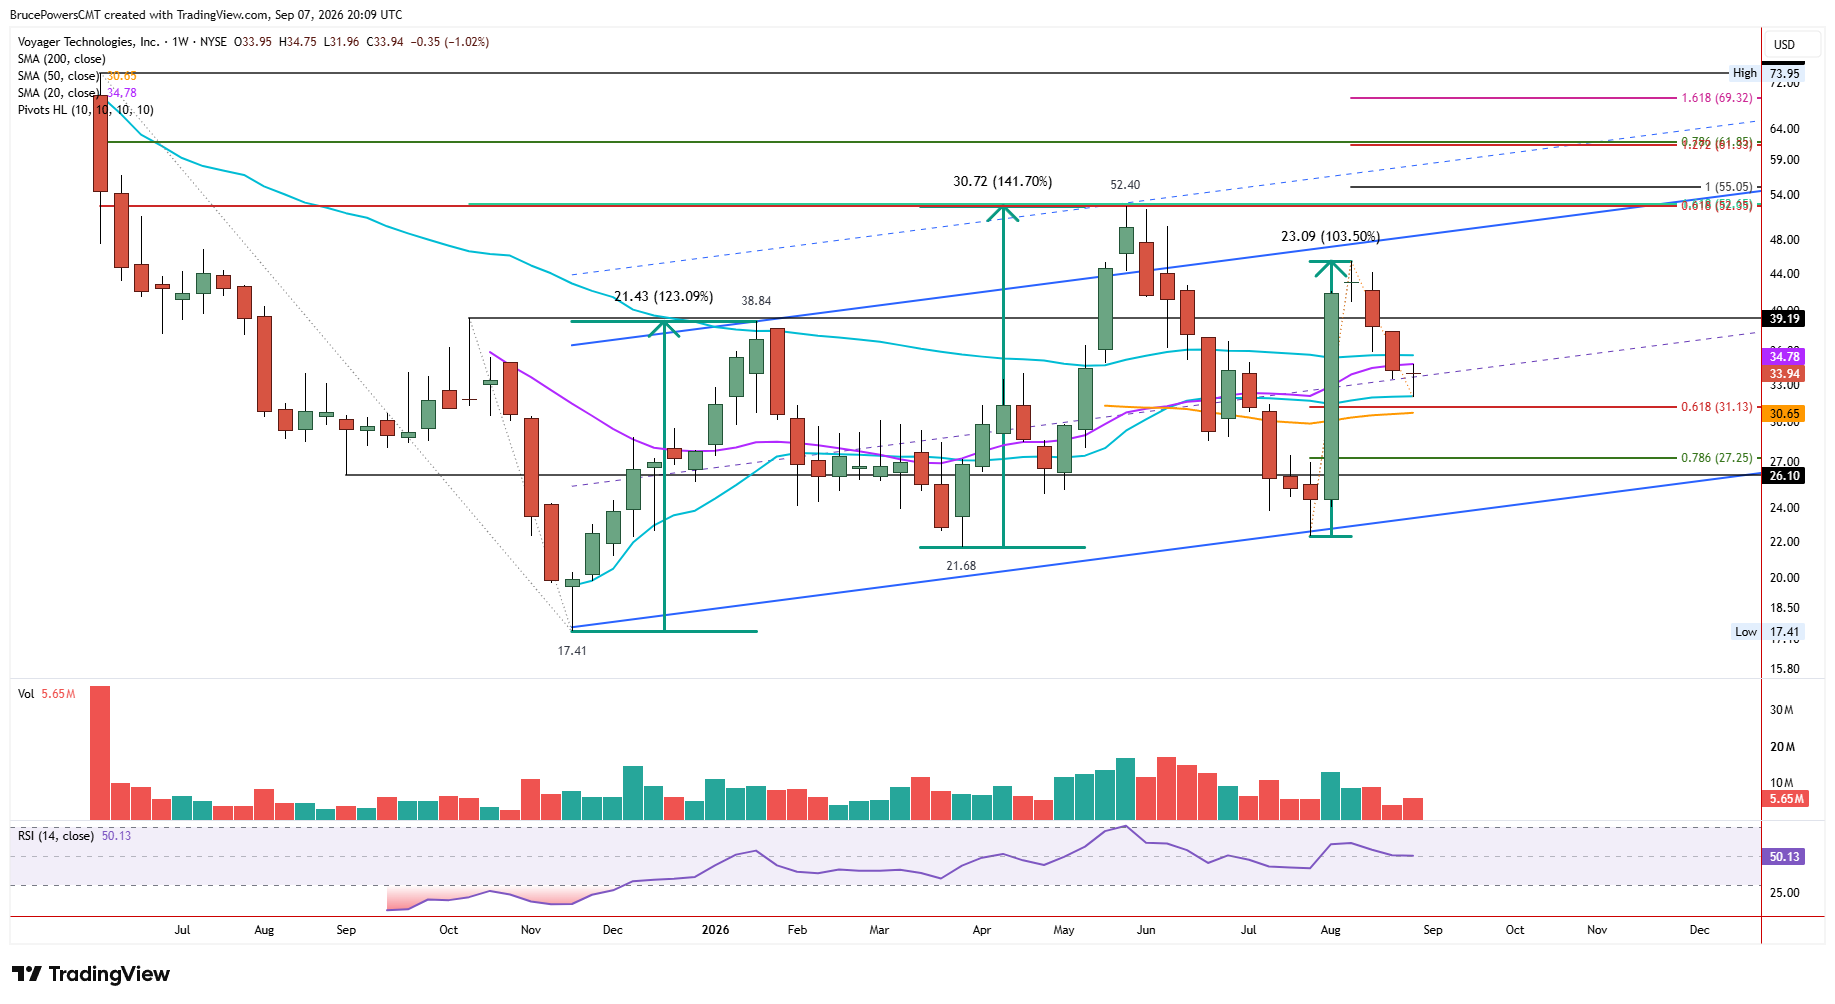
Weekly Reversal Could Add Confirmation
A three-day upside breakout from a bottoming pattern triggered on Friday and established a higher daily high of $34.49 and a five-day daily closing high of $33.94. Moreover, a bullish doji hammer reversal candle formed last week on the weekly chart. A bullish weekly reversal would therefore trigger on a rally above last week’s high of $34.75. This would provide another layer of confirmation that the $31.96 low may have marked the end of the pullback, particularly given its proximity to the November relationship to the weekly low and the November 2025 low AVWAP and 50-day moving average.
Measured Move Points Toward $51.75
Projecting a conservative measured move of the prior advance from last weeks low points to a potential resistance target near $51.75. That level aligns closely with the prior swing high of $52.40 from May, along with the 61.8% Fibonacci retracement of the prior decline, thereby adding to the significance of the zone as both an upside target and potential resistance. That initial estimated upside target is conservative because the measured move begins from the daily close of the earnings day, rather than from the swing low that preceded it. If the current support confluence holds and the weekly reversal confirms, the resulting advance could therefore have considerably more room than the conservative initial target suggests.