


$3.00 Test Keeps Bullish Structure Alive
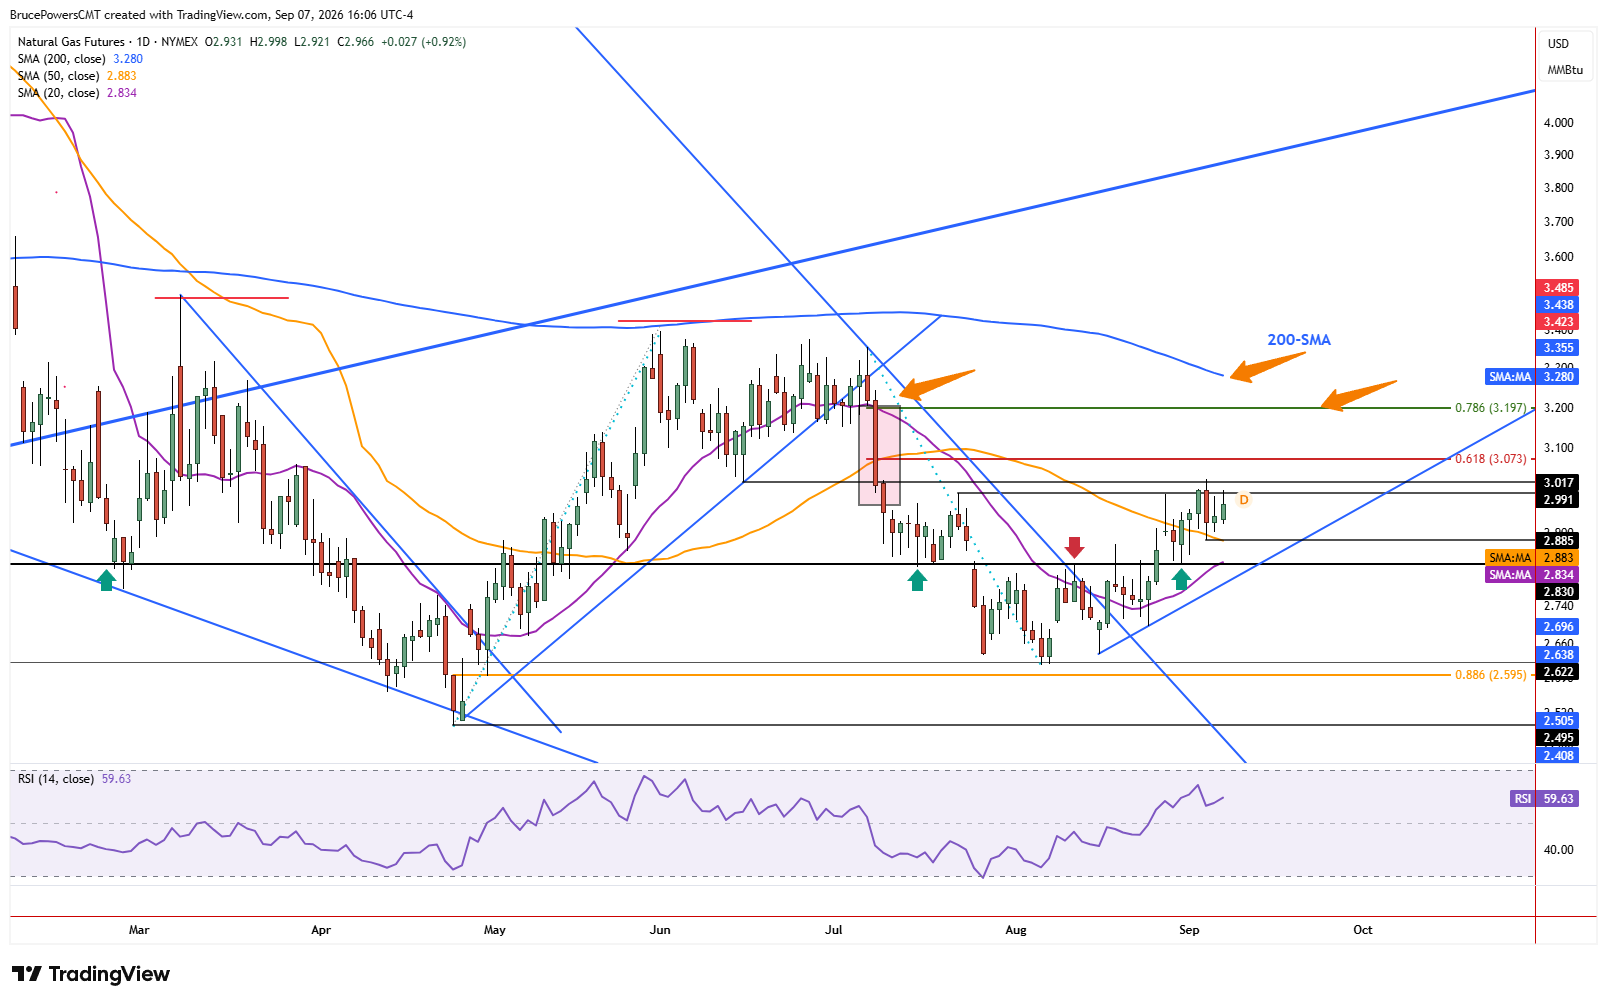
Natural gas showed strength on Monday, as it advanced above Friday’s high to generate a higher daily high of $3.00. That was another test of a key resistance zone near the lower swing high from July. Even though the session was shortened due to a U.S. holiday, Monday’s higher daily low of $2.92 also showed strength. This was the fourth full day above the 50-day moving average, after it had represented resistance previously, further showing improving underlying demand. The ability to hold above this moving average while pressing against resistance keeps the recent bullish reversal structure intact.
Breakout Level Comes Into Focus
Last Wednesday’s bearish outside day holds key support and resistance levels, at $2.89 and $3.03, respectively. But with support holding at the 50-day moving average and following a bullish reversal signal from a bottom consolidation pattern a couple weeks ago, natural gas may still be in the early portion of a larger advance. Given recent bullish price action and the larger pattern, an eventual test of resistance near the 200-day moving average looks possible. A decisive move above $3.03 would provide an initial sign that natural gas is ready to advance toward that higher resistance area.
Targets Stretch Into Major Resistance
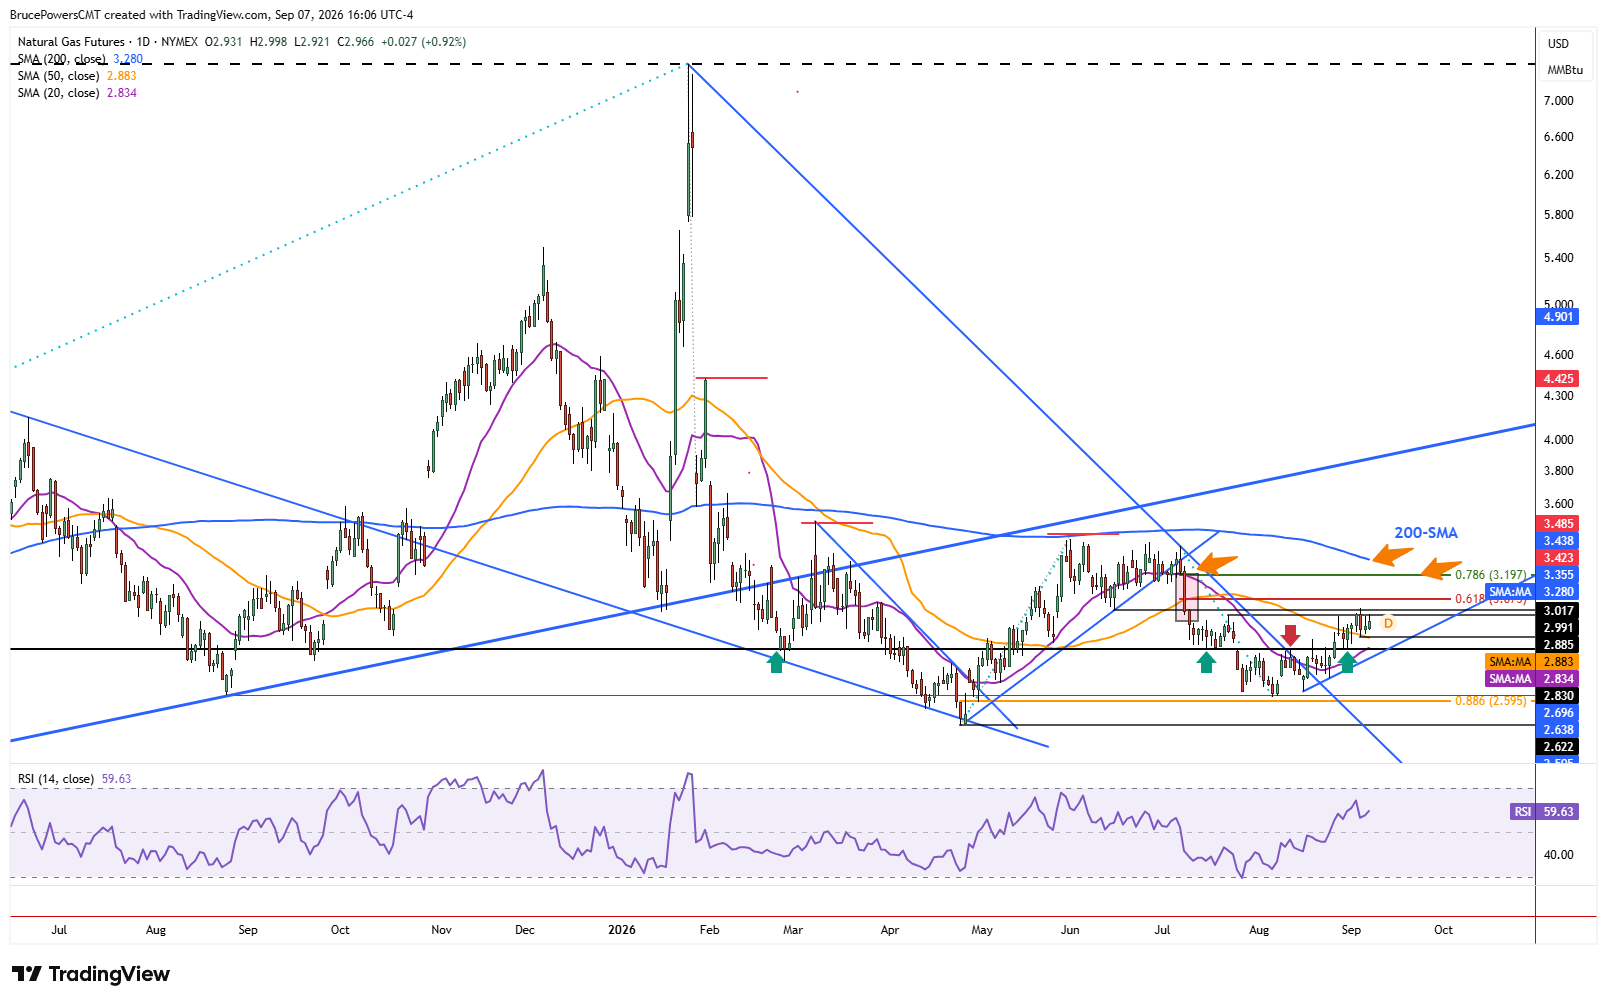
Currently, near $3.28 and falling, the 200-day moving average was confirmed as resistance during the recent advance that established a lower swing high in June. That makes it a potential upside target again. The other higher target of note is the 78.6% Fibonacci retracement at $3.20. It occurs at the end of an area where there were significant order imbalances during the prior decline. Once those areas are entered it is common for the full range to be tested before a move completes, thereby increasing the chance for the 78.6% retracement to eventually be tested. This creates a potential target zone that sits below the currently declining 200-day moving average.
Moving Average Shapes Timing
If the 200-day moving average reaches the 78.6% retracement before price reaches it, the chance of the level being tested again as resistance increases. And from a timing perspective, it would not be surprising to see the 200-day average reach the 78.6% zone before price reaches that area. Keep in mind that the 200-day moving average is in an area of resistance defined by a consolidation range that followed the June peak.
It is only a guide, and resistance could be seen anywhere within the zone that extends from around $3.12 to $3.40. Therefore, the recent strength above $3.00 could be an early step toward a broader test of this resistance zone, provided natural gas continues to hold its emerging support structure.
Natural Gas Price Forecast
Every new Natural Gas analysis as it publishes, today's technical signal and key levels, live price — on one page.
See all Natural Gas forecastsIf you’d like to know more about how to trade natural gas, please visit our educational area.