


Bullish Reversal Takes Shape
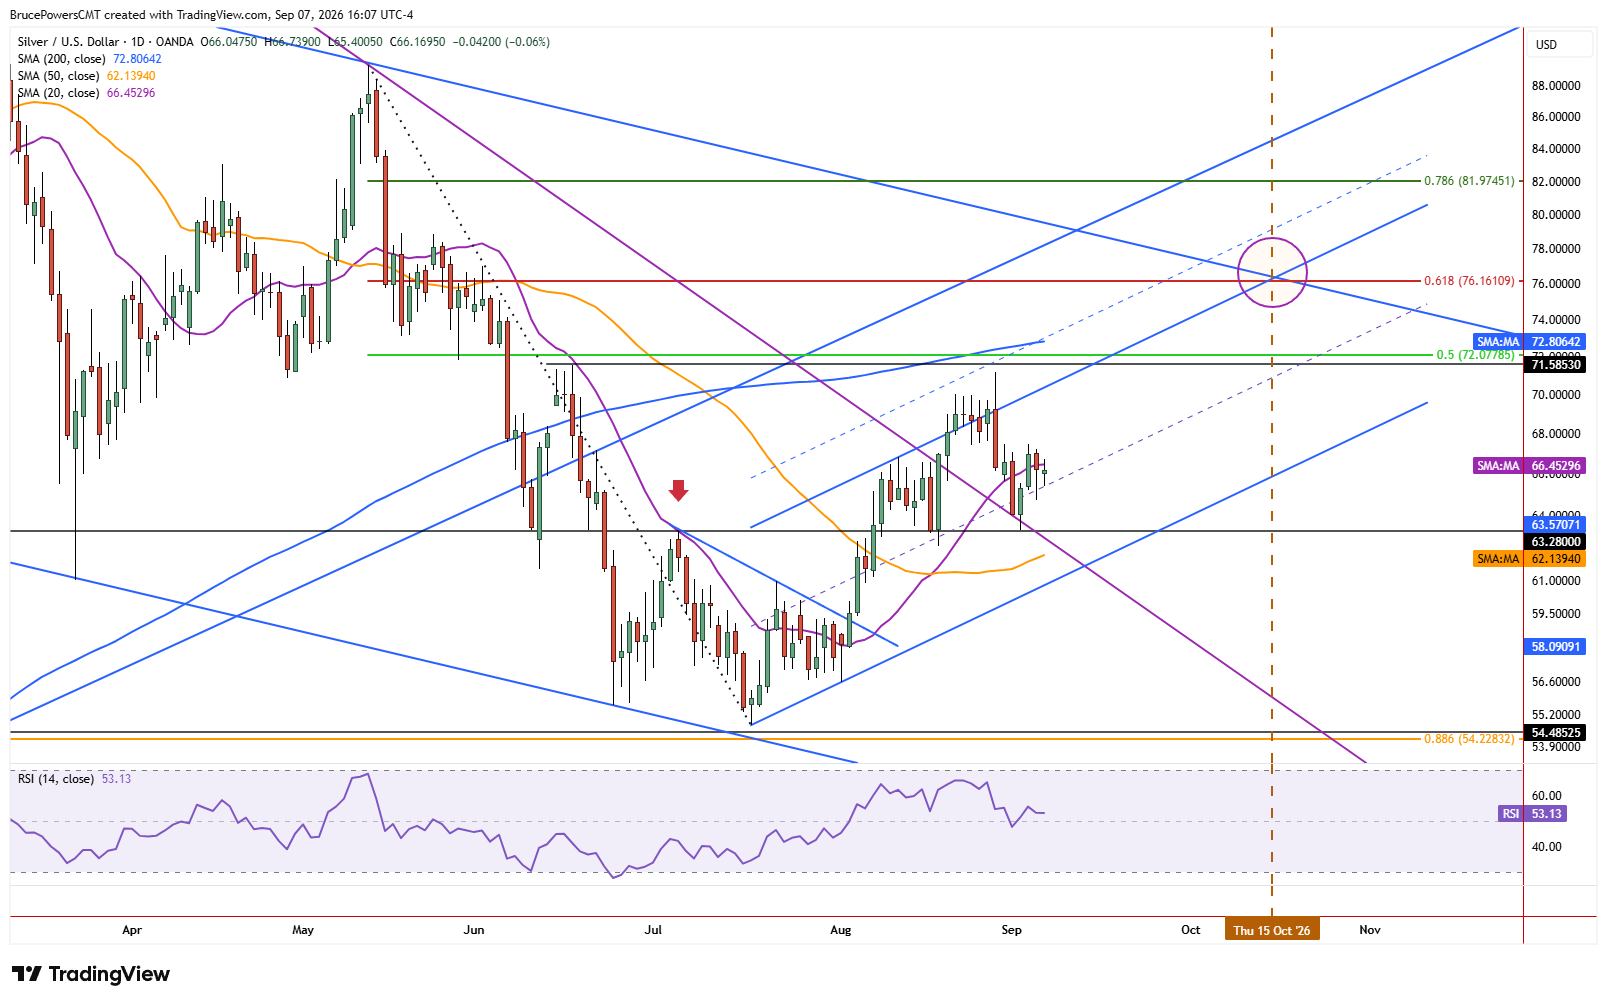
Silver formed a slightly higher swing low of $63.31 last week after successfully testing support near the lower swing high from July at $63.28. The recent rally above that high provided a bullish reversal signal within the prior downtrend structure. With support now being tested at a former resistance level, the next step is for buyers to demonstrate their intentions through renewed strength.
There are two additional supporting indicators as well that increase the significance of support at last week’s low. Both a lower swing high from early-July and a declining trendline converge near this area.
Key Support Sets Next Test
The $63.31 low is now key support, as a decline below it would remove the higher swing low. There is also dynamic support near the 50-day moving average at $62.14, which recently began to rise after going sideways for a few weeks. If support holds, silver is poised to show strength on a break above Thursday’s high of $67.47. The next upside target is then the recent high of $71.18. That level marks the beginning of a potential resistance zone that extends from a lower swing high at $71.56 to the 200-day moving average near $72.81.
200-Day Average Remains Critical
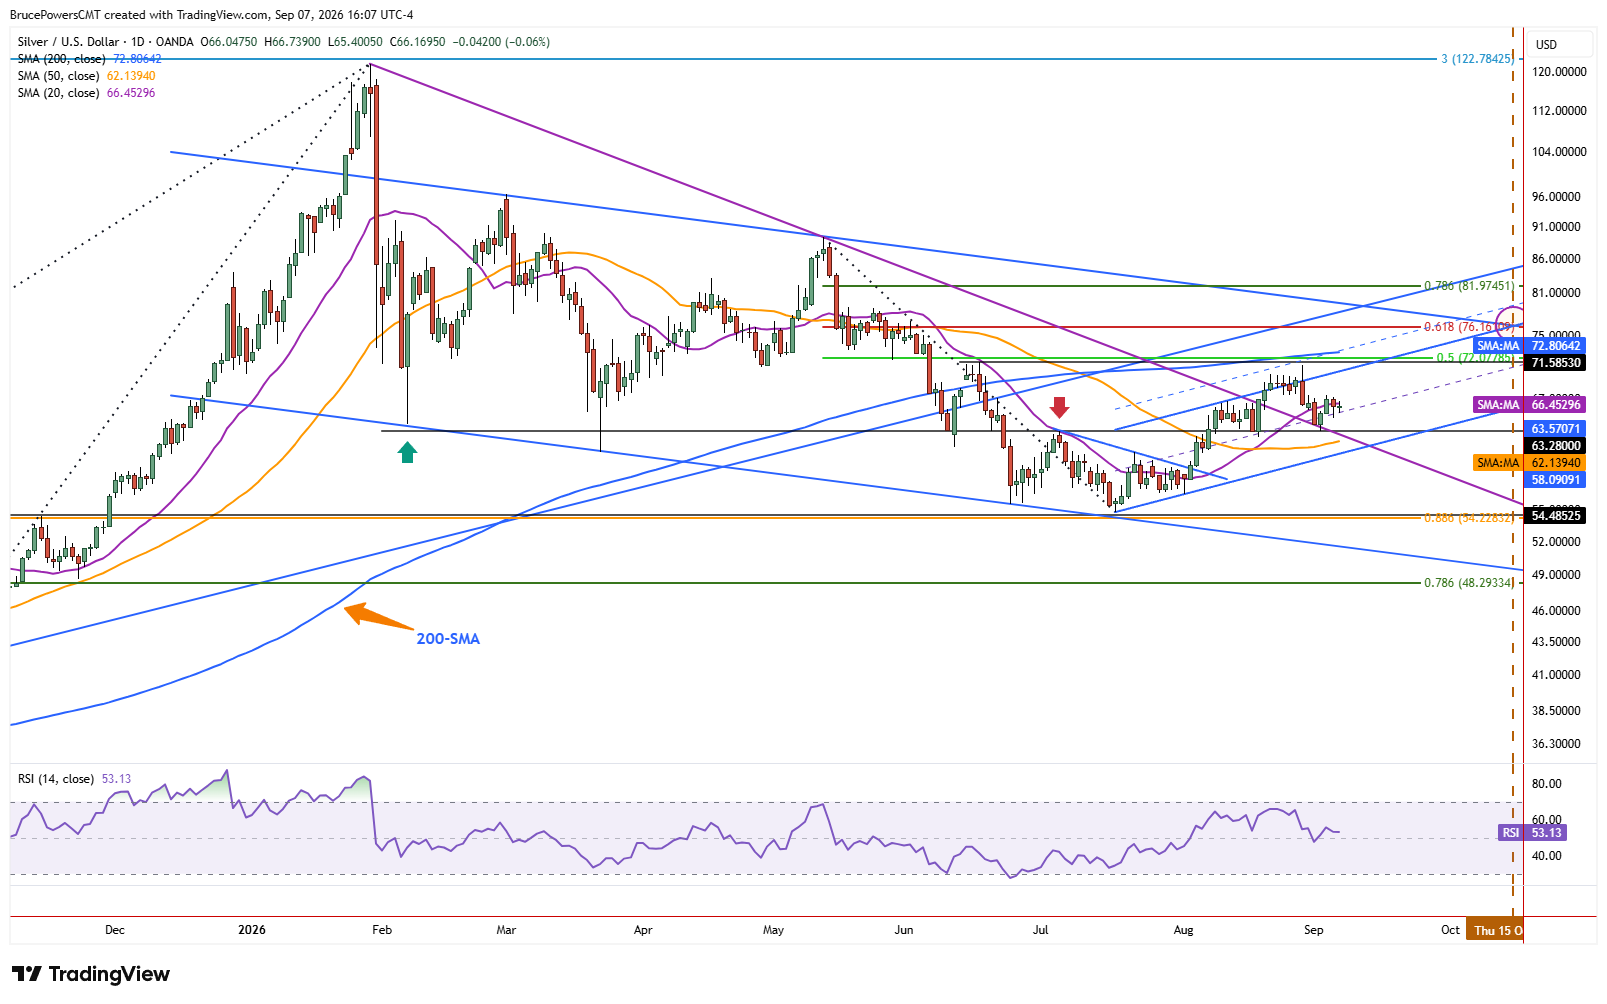
Another pattern unfolding is that the current advance from the July low represents the first pullback to test the 200-day moving average as resistance since silver broke below it in June. So far, resistance was seen during the advance two weeks ago. However, another upswing could develop, giving silver another opportunity to test that major long-term trend indicator. Even if the 200-day average is eventually reclaimed, further resistance remains likely during this initial approach to the average.
Channel Points Toward Higher Targets
There are also early signs of a rising channel forming since the July bottom. Notably, silver could advance toward the $71.56 to $72.81 range while remaining inside the boundaries of the channel. Another potential upside target is the confluence of several indicators, including the upper downtrend line, the 61.8% Fibonacci retracement of the prior decline at $76.16, and the upper boundary of the rising channel.
Weekly Signal Raises Stakes
Finally, the weekly chart shows that a bullish doji hammer candlestick pattern formed last week. Therefore, a breakout above last week’s high of $67.47 would not only confirm renewed short-term strength but also provide a bullish reversal signal on the weekly chart. That means that a breakout above last week’s high of $67.47 noted above, will also provide a bullish reversal signal on the weekly chart. That should reinforce the bullish reversal setup signaled by the July support test and increase the significance of the current advance.
Silver Price Forecast
Every new Silver analysis as it publishes, today's technical signal and key levels, live price — on one page.
See all Silver forecastsIf you’d like to know more about how to trade gold and silver, please visit our educational area.