



USOIL, UKOil & Natural Gas Outlook: Iran Conflict Tightens Gulf Supply as Hormuz Disruptions Deepen
Oil markets trends continue to reflect higher supply risk premiums associated with the Middle East. The renewal of hostilities between the U.S. and Iran and the slowdown of shipping through the Strait of Hormuz has impacted U.S. Gulf Coast exports. Only 7 vessels crossed Hormuz on Monday, compared to eight on Sunday. Iran has countered recent U.S. attacks and threatened more along with the establishment of maritime exclusion zones in the Gulf. This adds further tension to the energy shipping corridor of the world’s most important oil supplier.
The Middle East oil supply disruptions will have an immediate impact on WTI (USOIL) and Brent ( UKOil) . Based on data from Reuters, Middle East crude shipments have dropped from 18 million barrels a day prior to the conflict to about 11 million bpd. While Hormuz traffic is low and alternative pipelines and increased non-OPEC production helped make this less dire, there are still supply risks.
Those supply risks increased after the Iran-aligned Houthi forces attacked Saudi Arabia on Tuesday. Saudi authorities said an attack on Saudi energy facilities injured 73 people. The Saudi energy ministry said they would activate counter measures to protect their energy facilities and continue to operate the facilities.
While OPEC+ successfully offered no immediate impact on the markets, supply risks will remain dominant over the upcoming weeks. The U.S. commercial crude stocks dropping by 4.5 million barrels to 424.5 million barrels in the week ended August 28 by the EIA added further support to U.S. oil markets.
For natural gas, supply competition is becoming more acute globally as disruptions to Qatari LNG supply disrupt markets. European gas storage remains near records lows ahead of the winter, further warranting U.S. LNG exports. However, strong domestic production has buffer the U.S. from supply shock.
Fundamental bias: USOIL bullish, UKOil bullish, Natural Gas moderately bullish.
Natural Gas Technical Analysis: NG Holds Rising Trendline as $2.97–$3.03 Resistance Returns to Focus
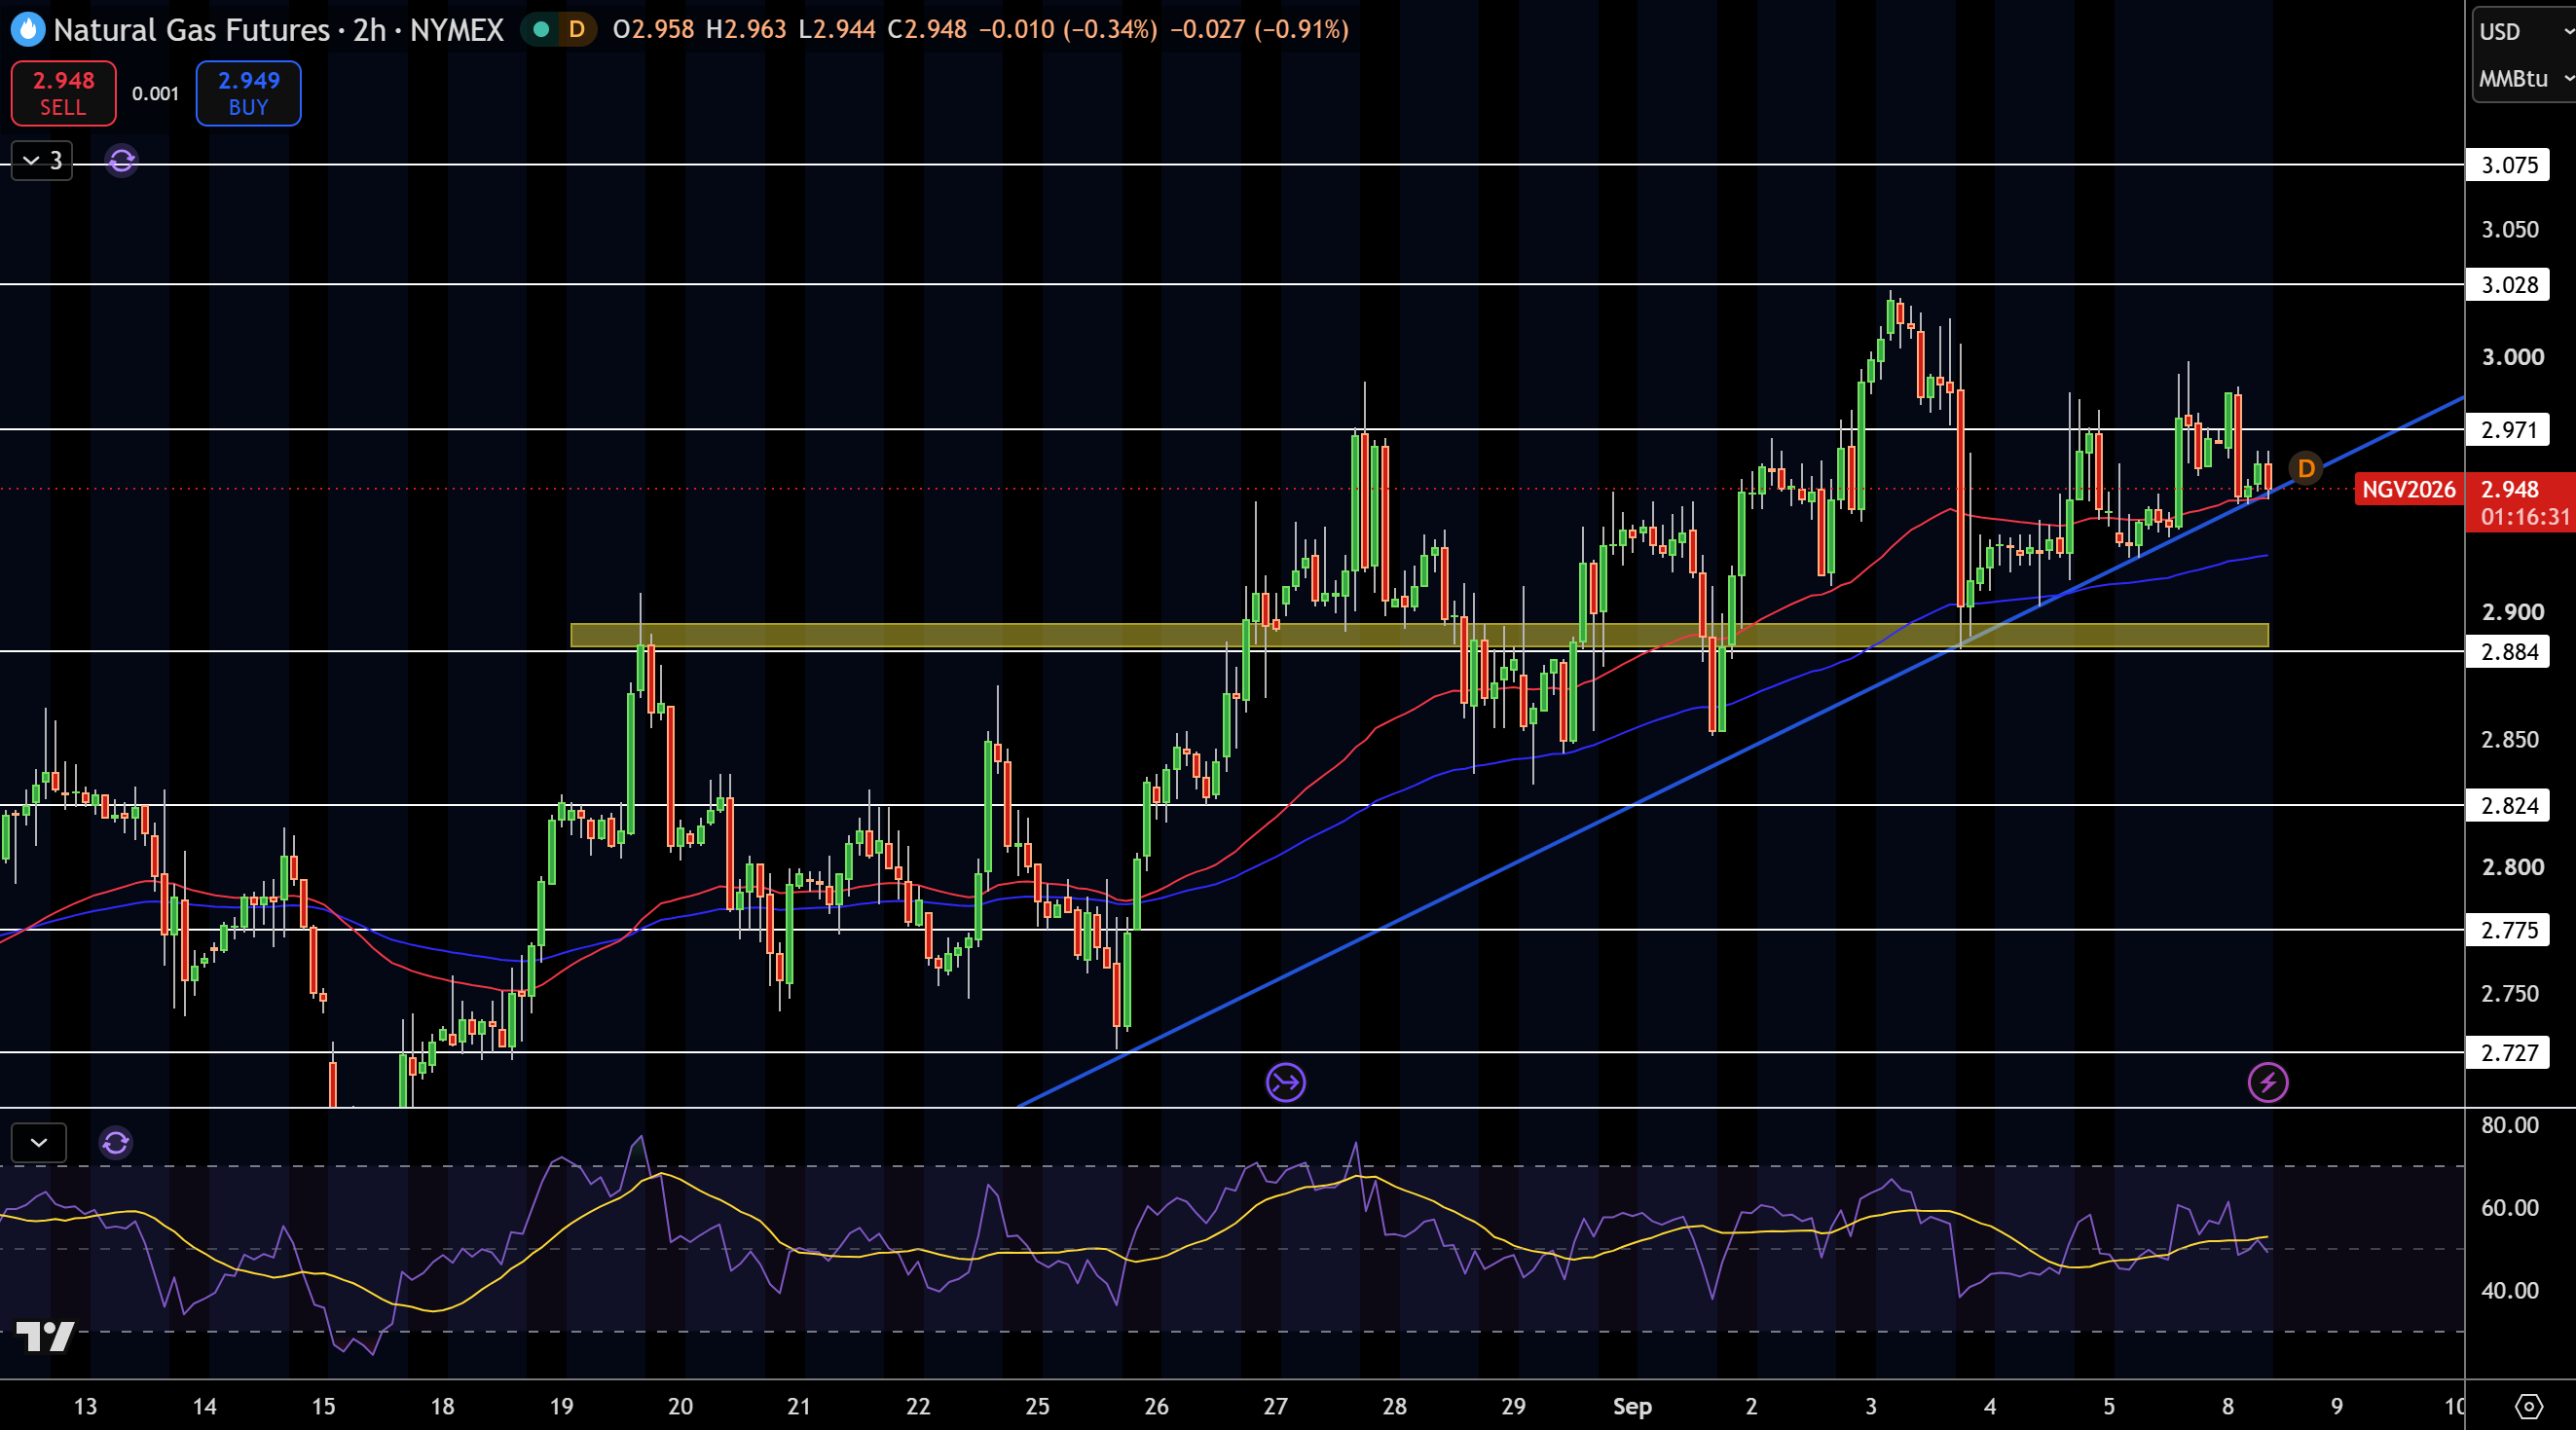
Natural gas is trading around $2.95 on the 2-hour chart and has successfully defended the rising trendline and $2.88–$2.90 support zone. I find it more interesting that natural gas has printed higher lows through the recent choppy action around the $2.97–$3.03 range. This action continues to support the bullish structure.
Price action has resistance at $2.97, $3.03, and $3.08. For support, we have $2.92, $2.88, $2.82, and $2.78.
RSI is trading in neutral-to-bullish territory and along with this action in natural gas above $2.88, I am very bullish. I would consider a move below $2.88 a loss of structure. A clean move above $2.97 would justify a move toward $3.03–$3.08.
Natural Gas Price Forecast
Every new Natural Gas analysis as it publishes, today's technical signal and key levels, live price — on one page.
See all Natural Gas forecastsWTI Crude Oil Technical Analysis: USOIL Presses $94.89 as Rising Channel Keeps Bulls in Control
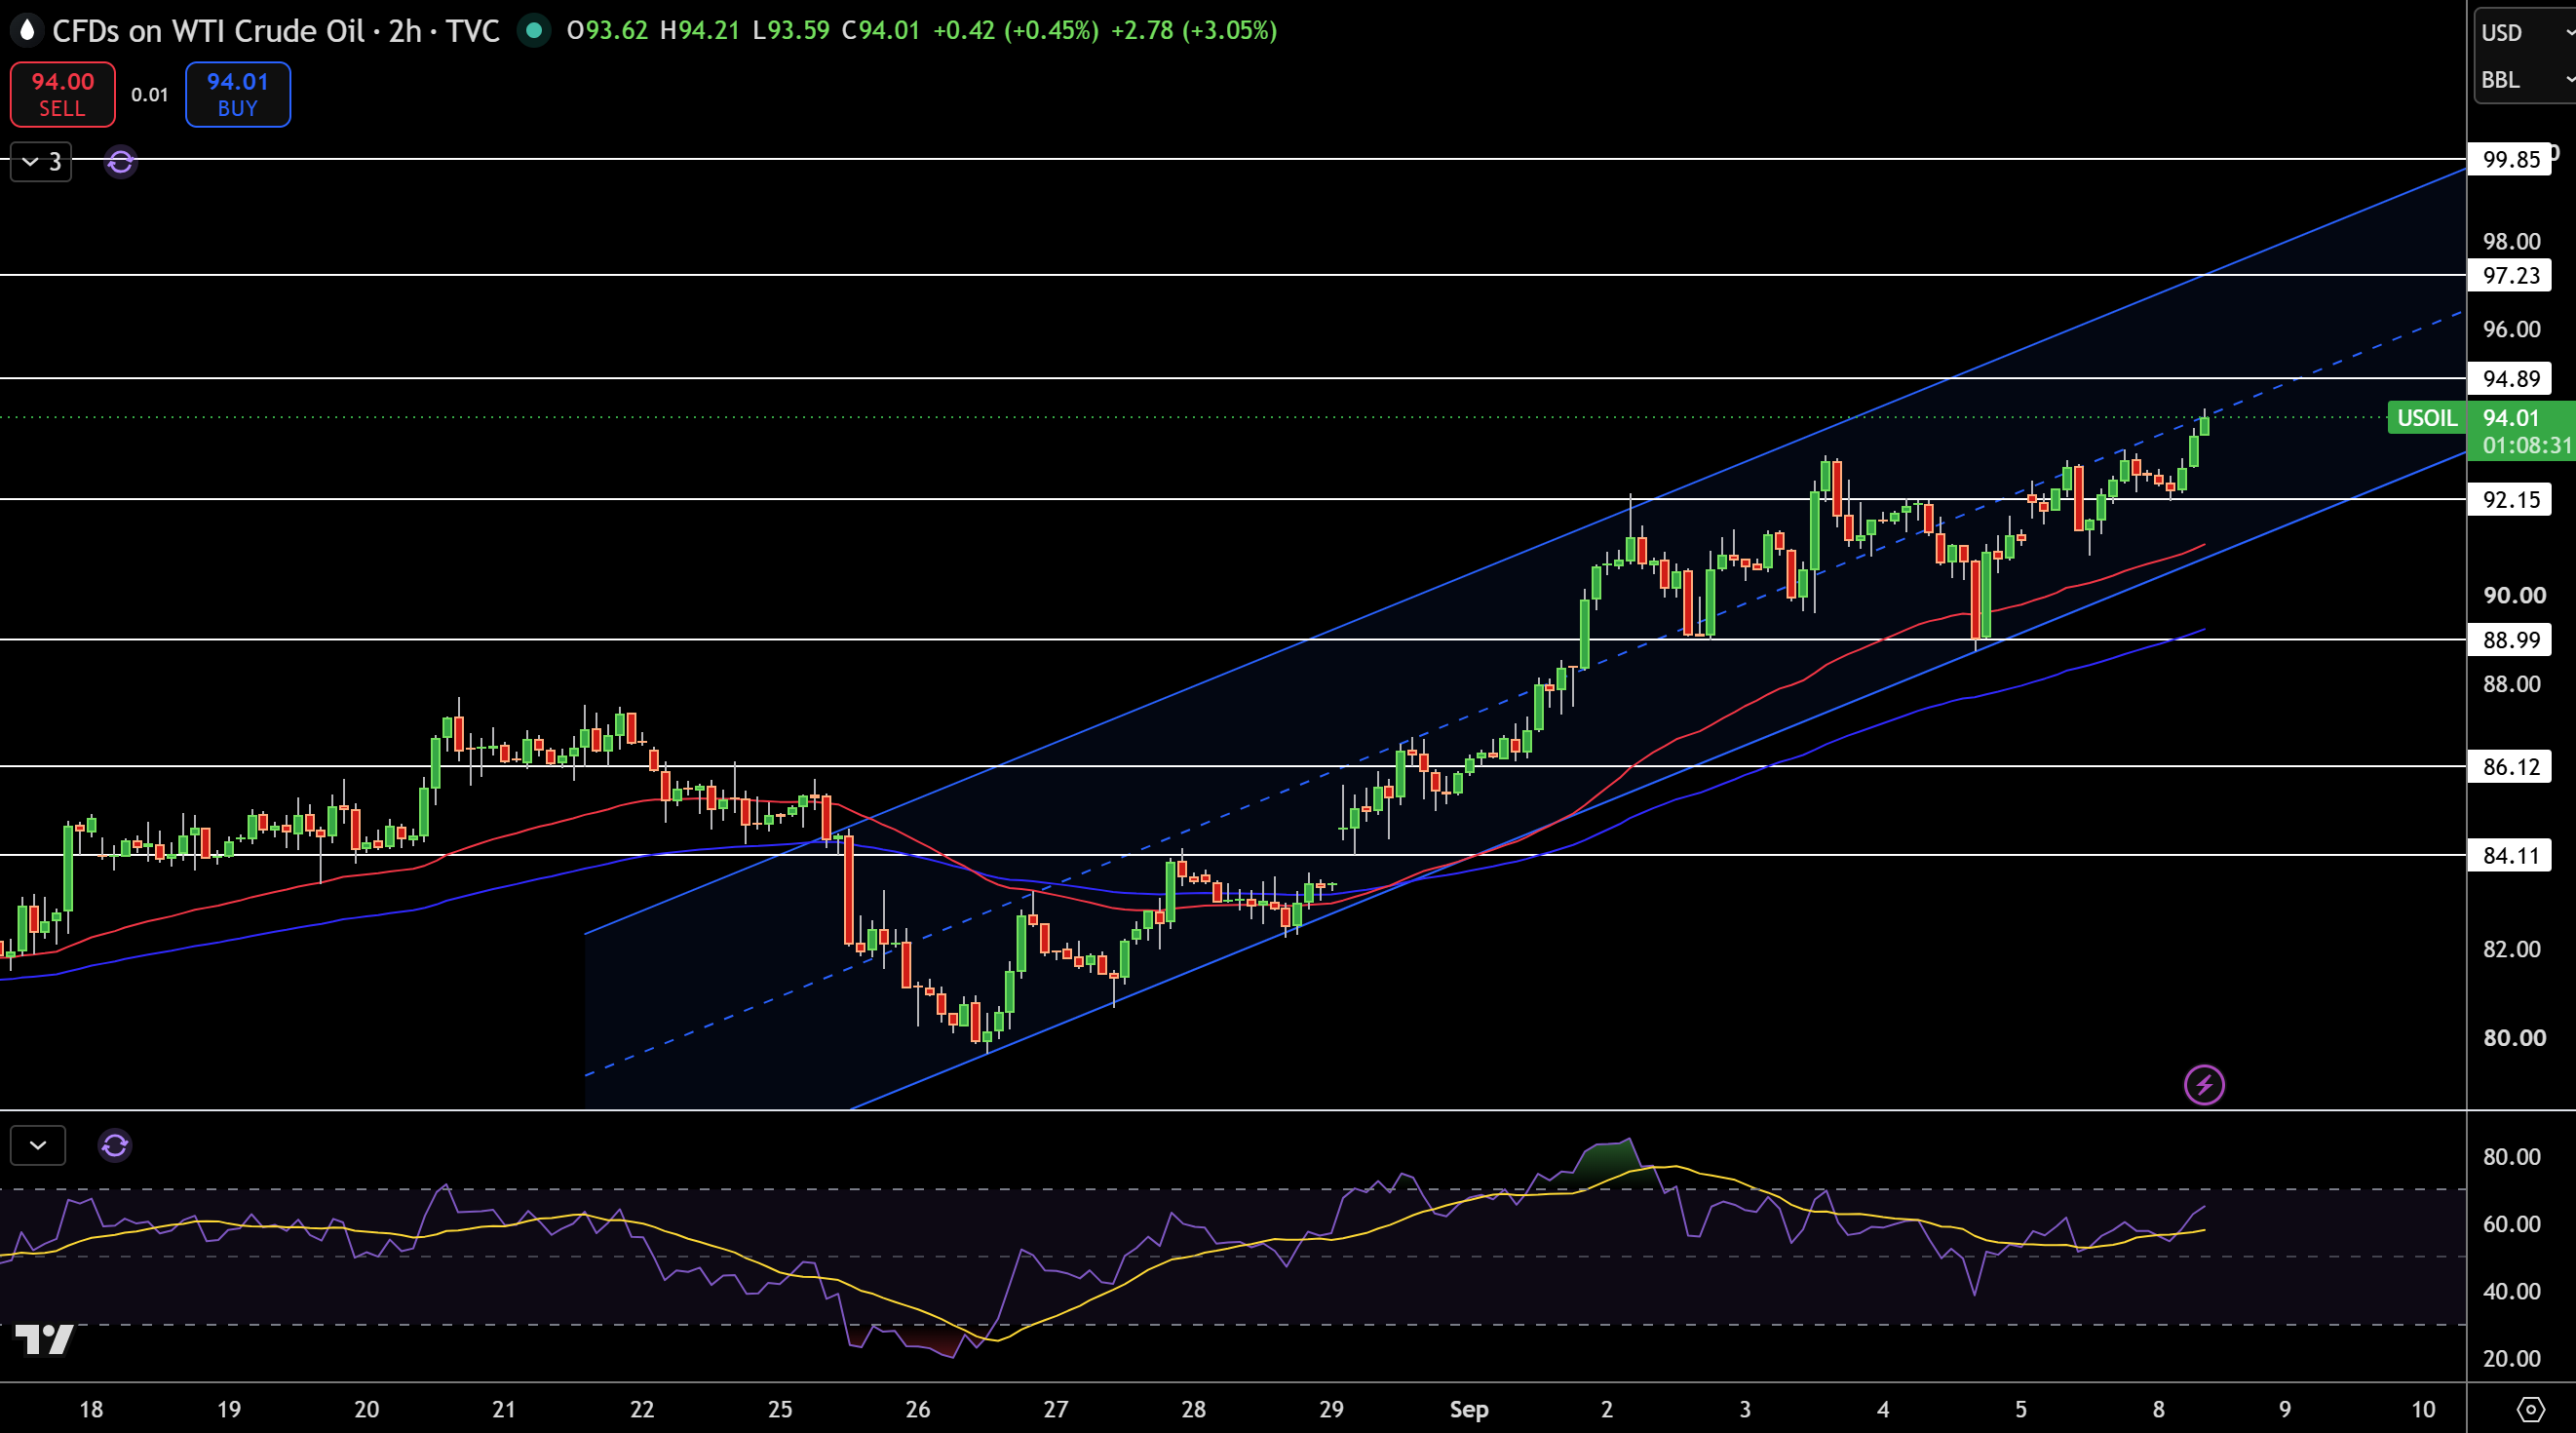
At $94.01, WTI crude oil has consolidated on the 2-hour chart, and I am noting the higher lows that form the rising channel. Bulls have been supporting prices above $89.89. Price is moving into the upper end of the channel and is approaching the resistance level of $94.89. This keeps the channel structure bullish and the short-term structure, overall, bullish.
To continue this structure in the favor of the bulls, I am looking at resistance level $94.89. A break above that would open $97.23 and $99.85, and support level $92.15 would be broken. At that price level, $89.89 would remain more important. Below that, $88.99 and $86.12 would be key levels to watch.
A move in RSI, with a break above $94.89 resistance would, also, help the structure. Overall, I prefer a long position until WTI moves below $92.15 and $89.89.
Brent Crude Oil Technical Analysis: UKOIL Breaks $96.95 as $99.41 Becomes the Next Target
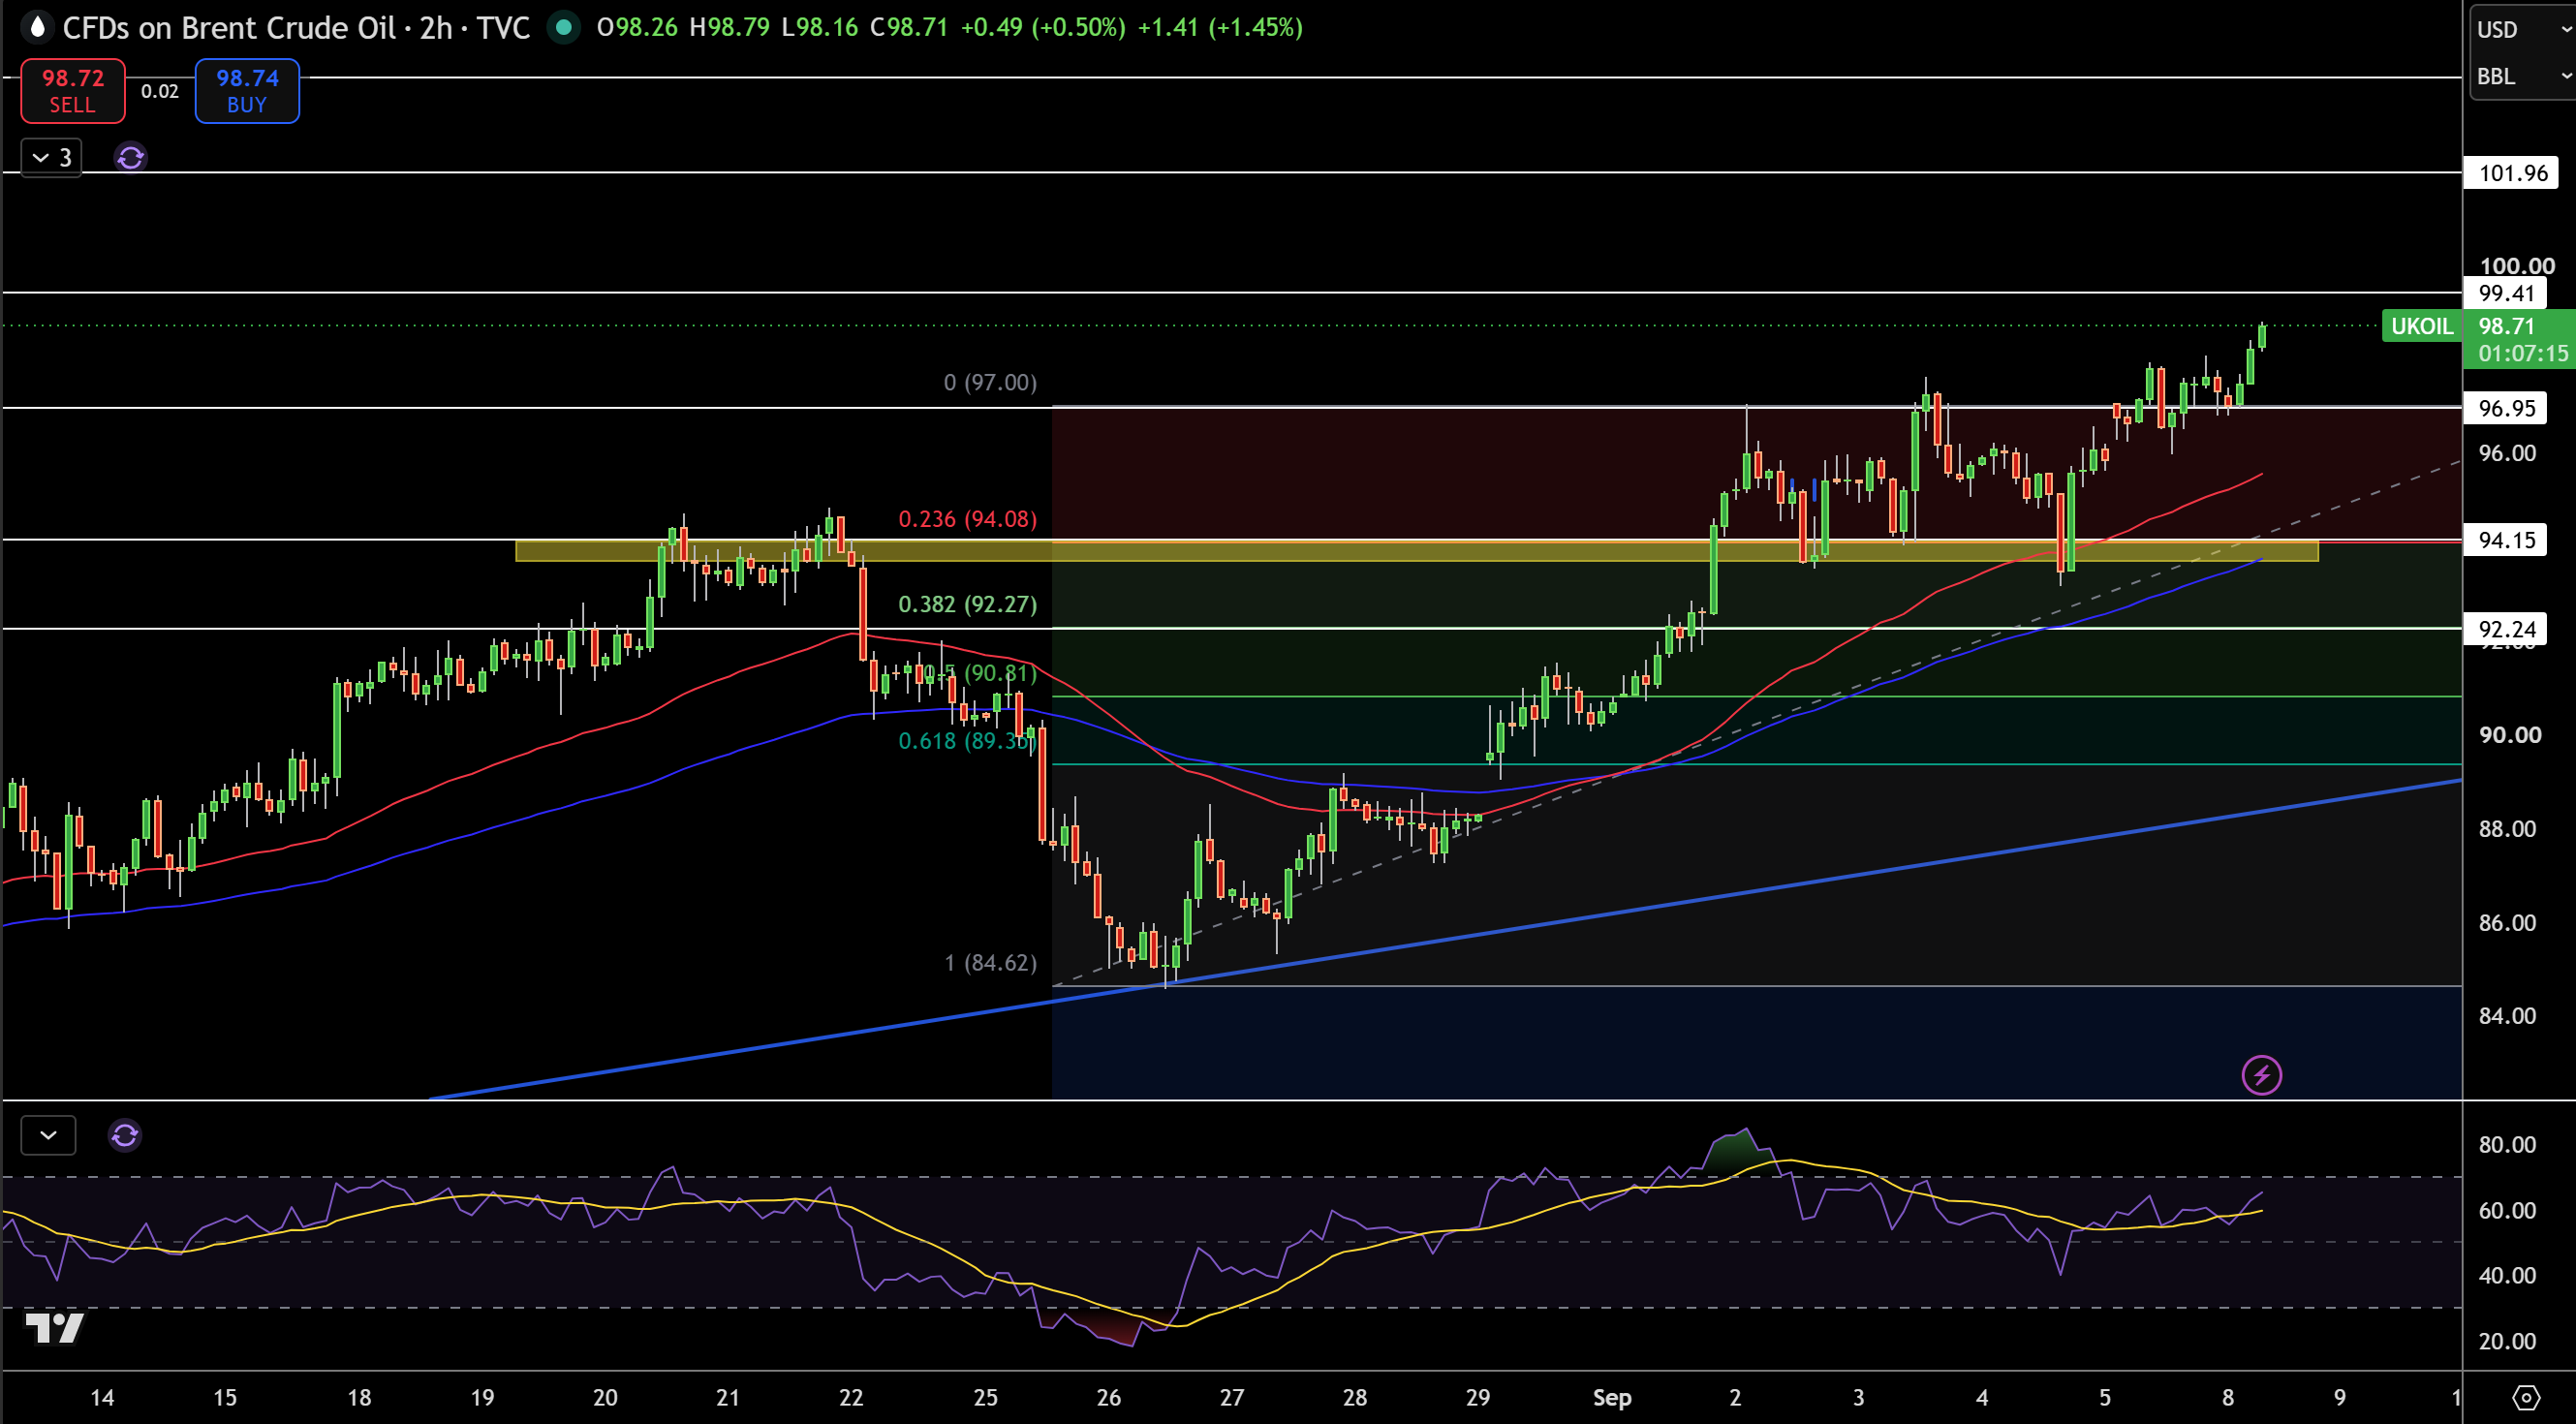
Brent crude is trading at $98.71, and I am focusing on the gap and break above the $96.95 level of resistance. I am watching the support levels of $94.15 in particular. Each of the levels in this range has been defended by buyers, and that makes me believe the recovery of the market is being controlled by buyers.
I have a gap and break in equilibrium, which is above $92.15 and especially above $89.89. A clear break below would invalidate the current thesis. An above $94.89 would justify a move to $97.23, which would be my next target.
The next level I am watching is $99.41, and if that level holds, the next level may be at $101.96. Should bullish sentiment continue, levels past $104 could be targets. On the downside, support might begin to form at $96.95, with $94.15 remaining the level that matters most structurally. Below that, $92.24 could come under pressure.
The RSI is also suggesting upward momentum, showing levels at $96.95 are areas I’ll be keeping an eye on as long as we stay above $94.15. A break below $94.15 suggests a possible breakout, but as long as we remain above that level, I expect levels at $99.41 and $101.96 to continue to test resistance.