The EUR/USD pair fell during the Friday session, as the 50-day exponential moving average offered dynamic resistance. However, the weekly candle is a
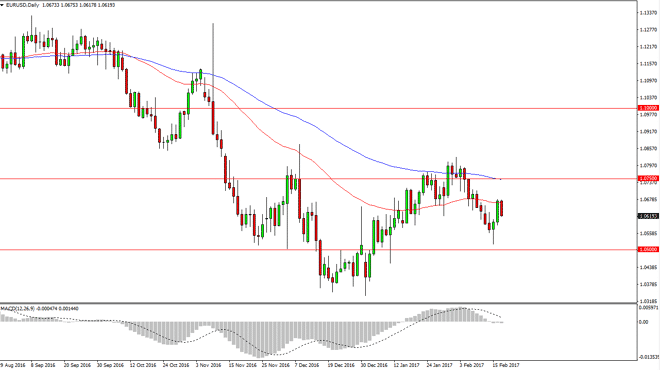
The EUR/USD pair fell during the Friday session, as the 50-day exponential moving average offered dynamic resistance. However, the weekly candle is a hammer, which is bullish. Because of this, I think the thing that we are going to see in this market more than anything else is going to be volatility. The 1.05 level below should continue to offer support, but the 50 day exponential averages obviously offering resistance. Because of this, I’m standing on the sidelines as his market looks likely to be very difficult to deal with. Given enough time, we will have to make a decision the right now I’m not confident in trading it.
Chris is a proprietary trader with more than 20 years of experience across various markets, including currencies, indices and commodities. As a senior analyst at FXEmpire since the website’s early days, he offers readers advanced market perspectives to navigate today’s financial landscape with confidence.