The FTSE 100 broke down significantly during the day on Friday, continuing the very bearish attitude that we have seen over the last couple of sessions.
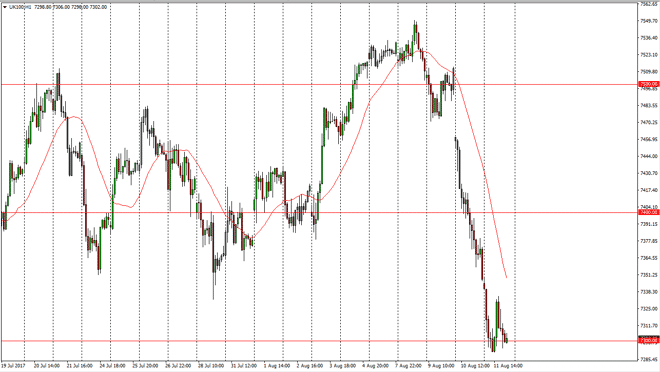
The FTSE 100 broke down significantly during the day on Friday, continuing the very bearish attitude that we have seen over the last couple of sessions. Having said that, we did give an attempt at rallying, but it failed. We now sit at the 7300 level, and the market looks to be making a decision as to whether he can continue to go much lower. I think if we rally from here, we could go as high as picking up the gap above, which could send this market towards the 7500 level. I would not be a buyer until we break above the highs from the session on Friday though, because it would show signs of strength, and would attract a lot of attention. If we break down, the market should then reach to the 7200 level, which is the next support level on short-term charts.
Chris is a proprietary trader with more than 20 years of experience across various markets, including currencies, indices and commodities. As a senior analyst at FXEmpire since the website’s early days, he offers readers advanced market perspectives to navigate today’s financial landscape with confidence.