Gold (XAU) prices fell on Thursday and hit the lowest level in over two weeks. The oil price climbed as supply disruption fears mounted in the Middle East as tensions increased. Rising oil prices may contribute to higher inflation. The Fed may keep interest rates higher amid higher U.S. inflation, which keeps pressure on gold and silver prices at their key support levels.
The US Treasury yields and the US dollar also remain strong. The recent inflation data was softer. But the higher energy prices and the expectations of higher energy inflation increase the odds of a rate hike by the Federal Reserve in September. The Fed may not be as willing to take a more dovish tone following the inflation data as energy prices remain strong.
Silver (XAG) prices could also come under selling pressure as they tend to mimic gold’s movements during sharp market moves. An increase in yield and a stronger dollar can dampen demand for both metals. But the silver will also be influenced by industrial demand. Therefore, the decline in silver might be different. As long as oil prices remain high and rate hike expectations grow, gold and silver may remain under pressure until yields and the dollar begin to ease.

Gold Price Forecast: Break Below $4,000 Puts $3,850 Support in Focus
XAUUSD Daily Chart Targets the $3,850 Support Region
The daily chart for spot gold shows that prices remain under pressure. Prices broke below the $4,000 area and continue to move towards the $3,850 support region. This support is defined by the lower boundary of the wedge pattern. A break below $3,850 will indicate a strong move to the downside.
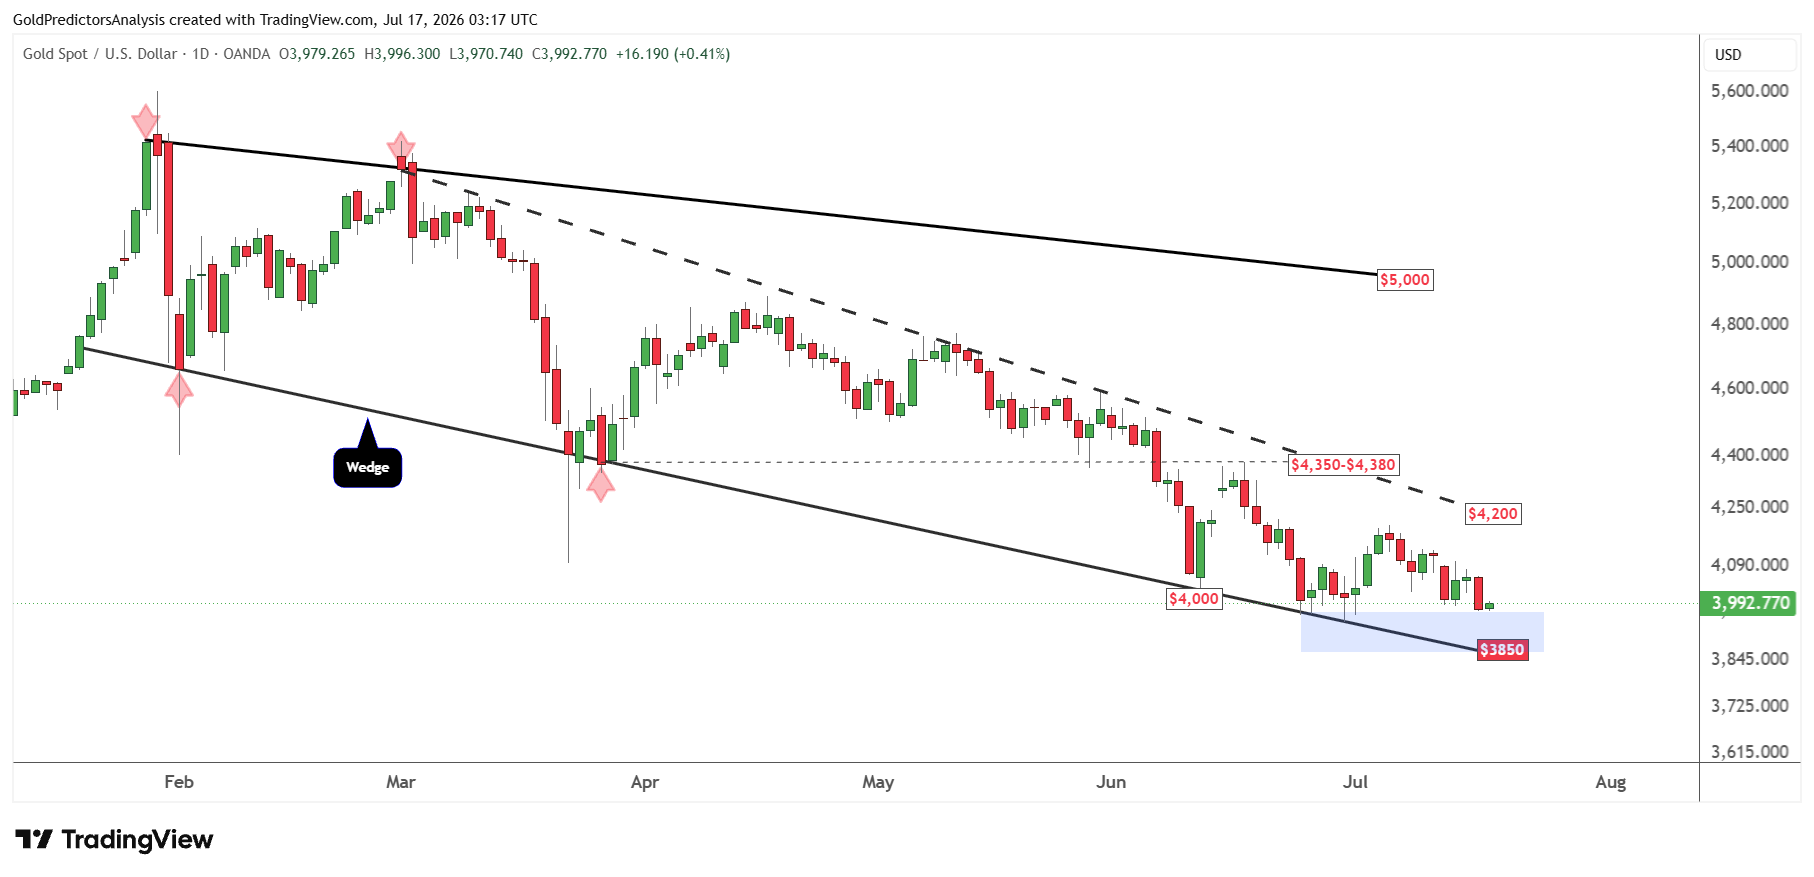
But a strong recovery above $4,200 after a drop to $3,850 will increase the chances of an upside breakout. A break above $4,200 will push prices towards $4,350. On the other hand, a break above $4,350 will open the door for a move towards the $5,000 area. A break below $3,850 will increase the chances of a strong and quick drop in the gold market to mark the final low.
Gold Must Reclaim $4,200 to Confirm a Bullish Reversal
The 4-hour chart for spot gold also shows strong bearish price action since March 2026. The formation of rounding tops below $5,000 and then below $4,500 indicates bearish pressure in gold. Prices must recover above $4,200 in the short term to confirm bottom and initiate a rally towards $4,500. A break above $4,500 will be a positive sign and open the door for a move towards $5,000.
Gold Price Forecast
Every new Gold analysis as it publishes, today's technical signal and key levels, live price — on one page.
See all Gold forecasts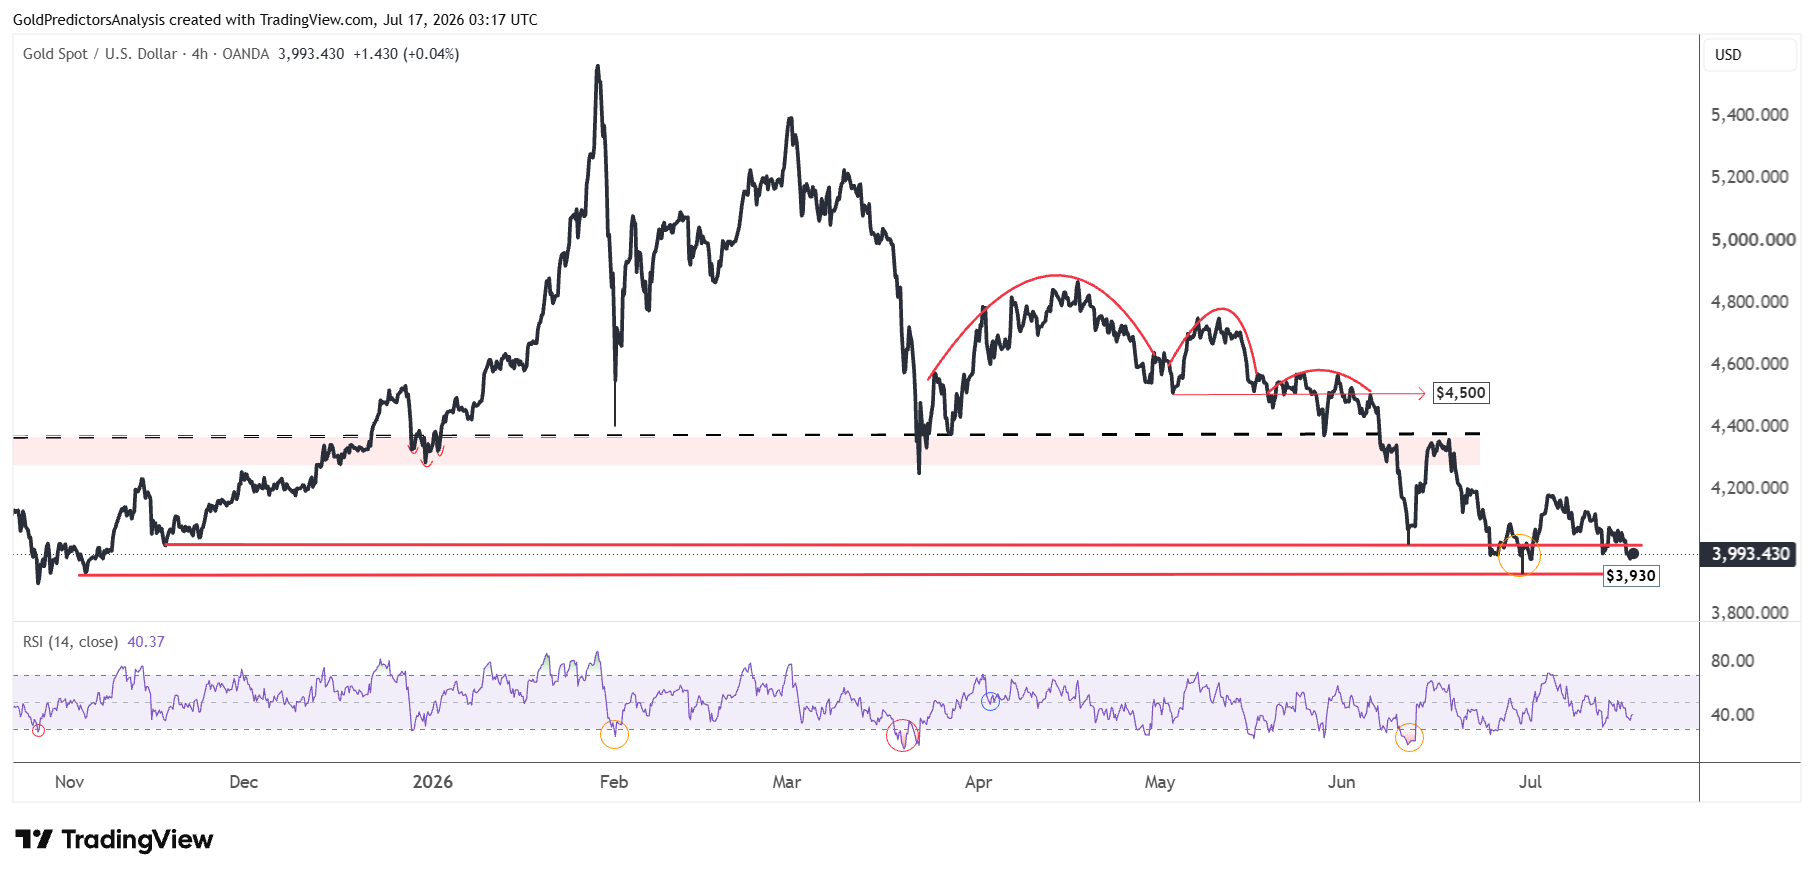
Gold Wedge Pattern Signals Volatility Near $3,800 Support
Another 4-hour chart for spot gold shows that the price is now approaching the apex of wedge. A break above $4,200 is required to break the wedge pattern and open the door for further upside. But the immediate support remains in the $3,900 to $3,800 region.
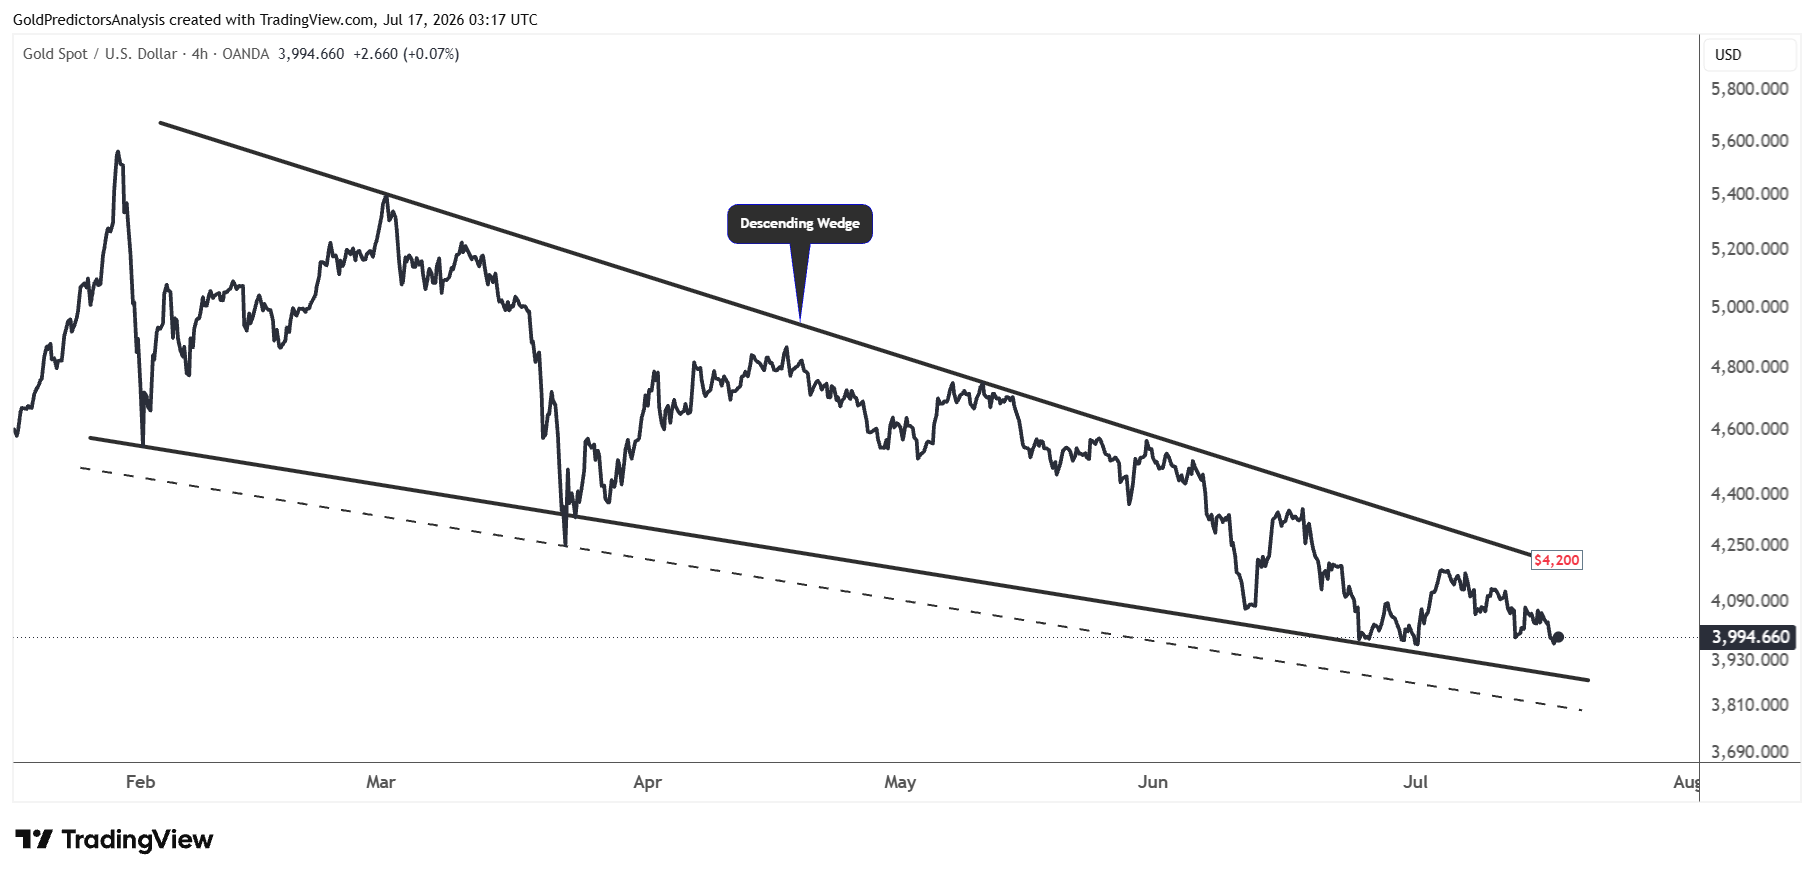
As long as the $3,800 region holds, the possibility of strong rebound remains. But July is known for choppy and overlapping movements in the gold market. Therefore, the short term price direction may remain uncertain. There might be erratic movements in the gold market before the final move in either direction.
Silver Price Forecast: Bearish Momentum Puts the $45–$55 in Focus
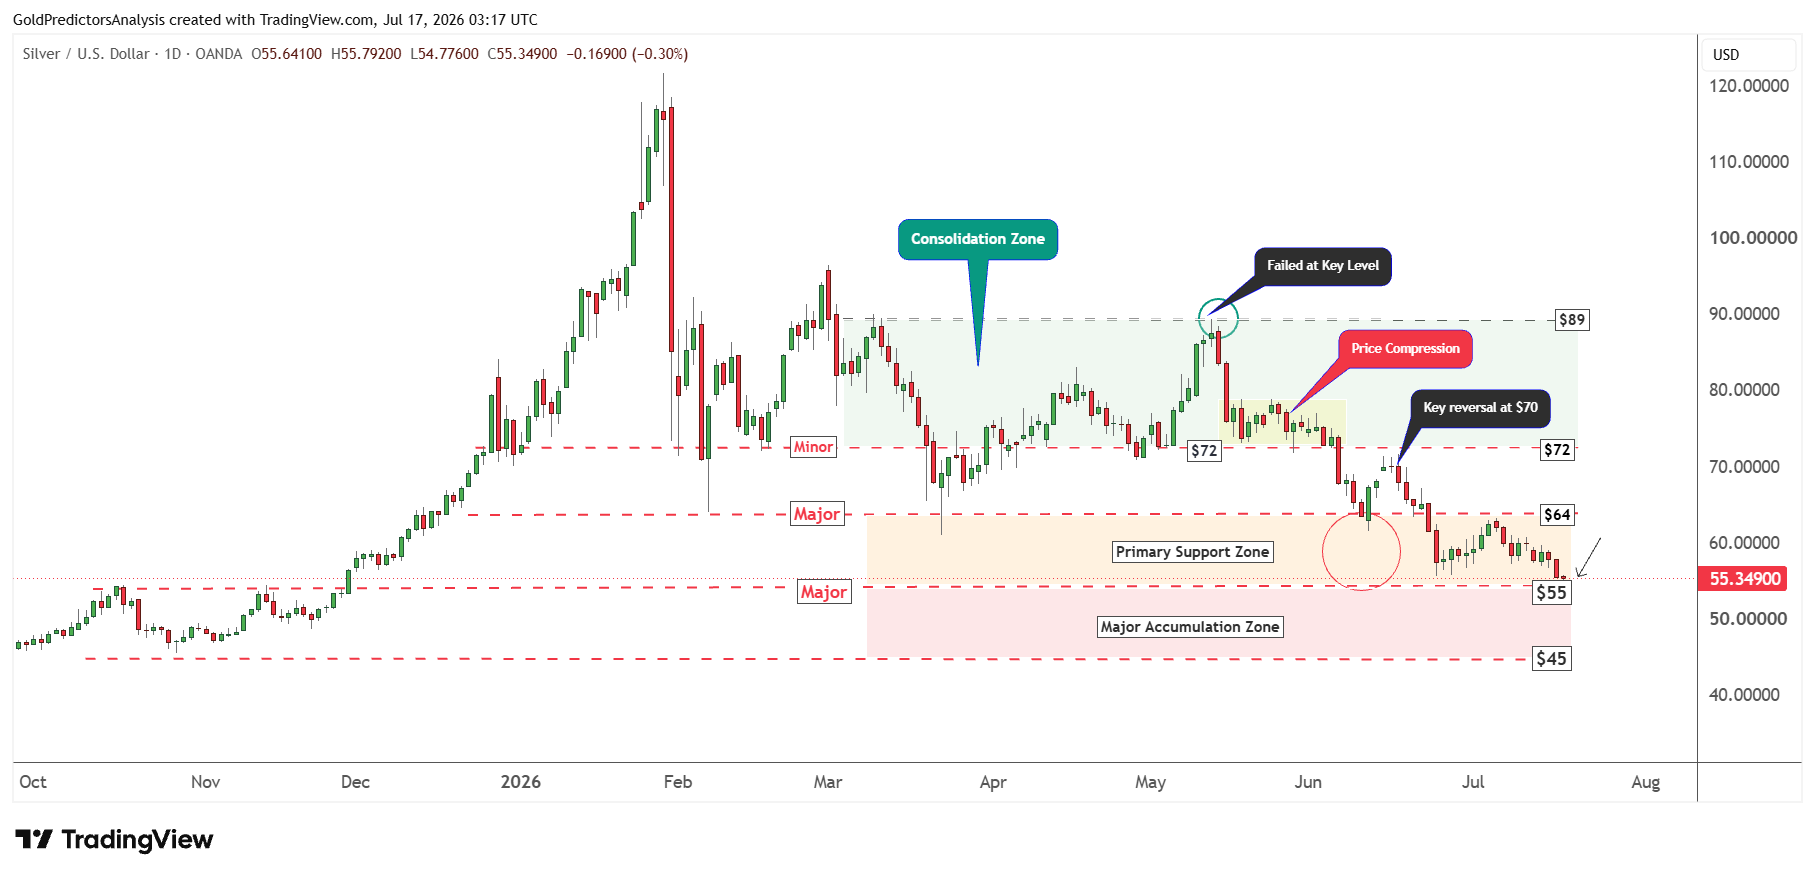
Silver Daily Chart Tests the Critical $55 Support Level
The daily chart for spot silver shows the same bearish pressure below the $64 area. The price is now approaching the lower boundary of primary support region at $55. A break below $55 will open the door for a move towards the major accumulation zone between $45 and $55.
As long as the $45 support holds in spot silver, the possibility of strong rebound towards $72 remains high. However, silver prices remain under bearish pressure and look set to move towards the $45 to $50 area in the short term.
Silver Break Below $55 Could Trigger a Drop Toward $45–$50
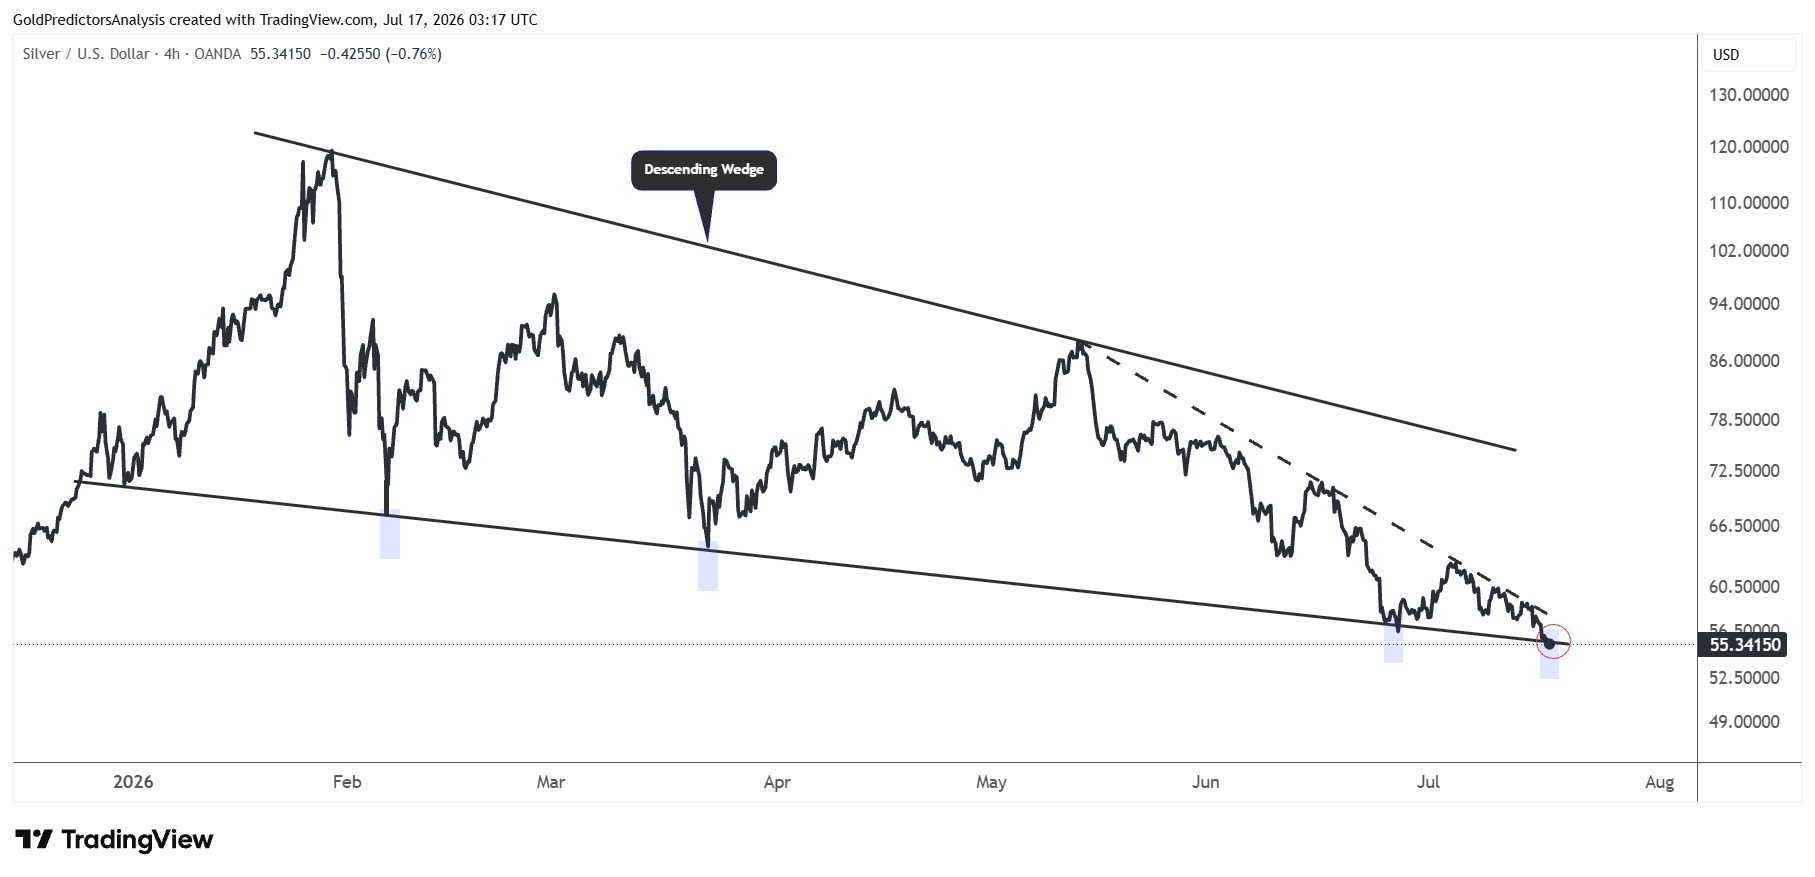
The 4-hour chart for spot silver also shows strong bearish pressure as the price is now approaching the lower boundary of the base pattern. The black dotted trendline extending from the May 2026 highs indicates that prices remain under extreme bearish pressure.
A break below $55 will open the door for a move towards the $50 area. On the other hand, a break below $50 will indicate further downside towards $45, which is considered the final drop before the next rally higher.
Bottom Line
Gold and silver remain under pressure as oil prices, Treasury yields and the US dollar stay strong. The spot gold price may test the support zone of $3,800-$3,850 before the next strong recovery. Silver could also move towards the $45 to $50 area if the $55 support breaks. These lower levels may attract buyers but the short term trend remains weak. Gold needs to recover above $4,200, while silver needs to break $64 to improve the bullish outlook. Both metals may remain under pressure until the US Treasury yields start to ease.
Read more: Rising Oil Revives Inflation Risks as Gold Tests $4,000