


Gold (XAU) and silver (XAG) prices rebounded after the US inflation data that lowered the chances of further Fed rate hikes. The headline CPI dropped to 3.5% in June and core inflation also cooled off to 2.6%.
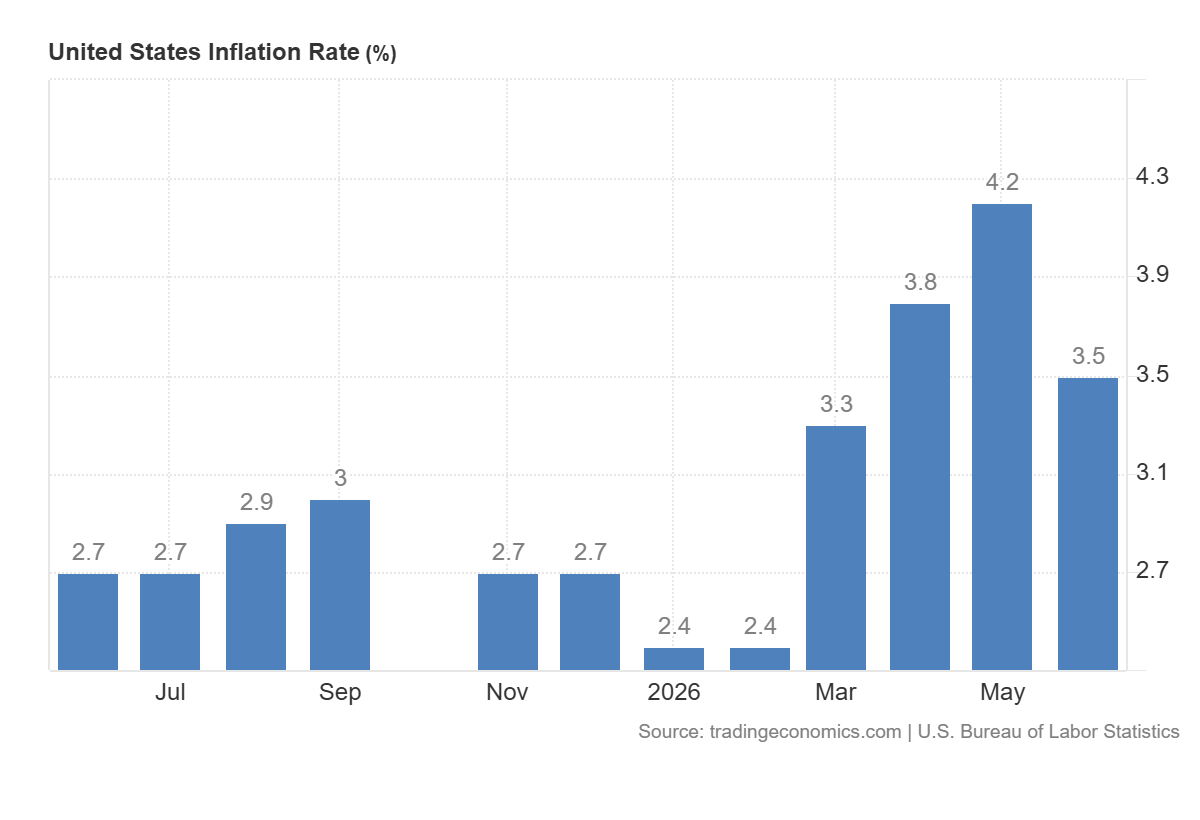
The inflation data supported the precious metals outlook in the short term but the escalation in the Middle East and higher oil prices still create uncertainty and the possibility of another inflation shock in the coming months.
The Brent oil has shown positive momentum around the $87, while the WTI oil remains strong at $80. US strikes against Iran have reignited worries over shipping through the Strait of Hormuz. If oil prices remain above $80, it would boost transport and production costs. This may force the Fed to keep the interest rates higher for longer and cap the potential gains of gold and silver.
The short term momentum for gold and silver may remain uncertain due to the uncertainty from the Middle East crisis. A further escalation may boost the oil prices and inflation which may keep the precious metals under pressure.

Gold Price Forecast: $4,200 Resistance Caps CPI Rebound
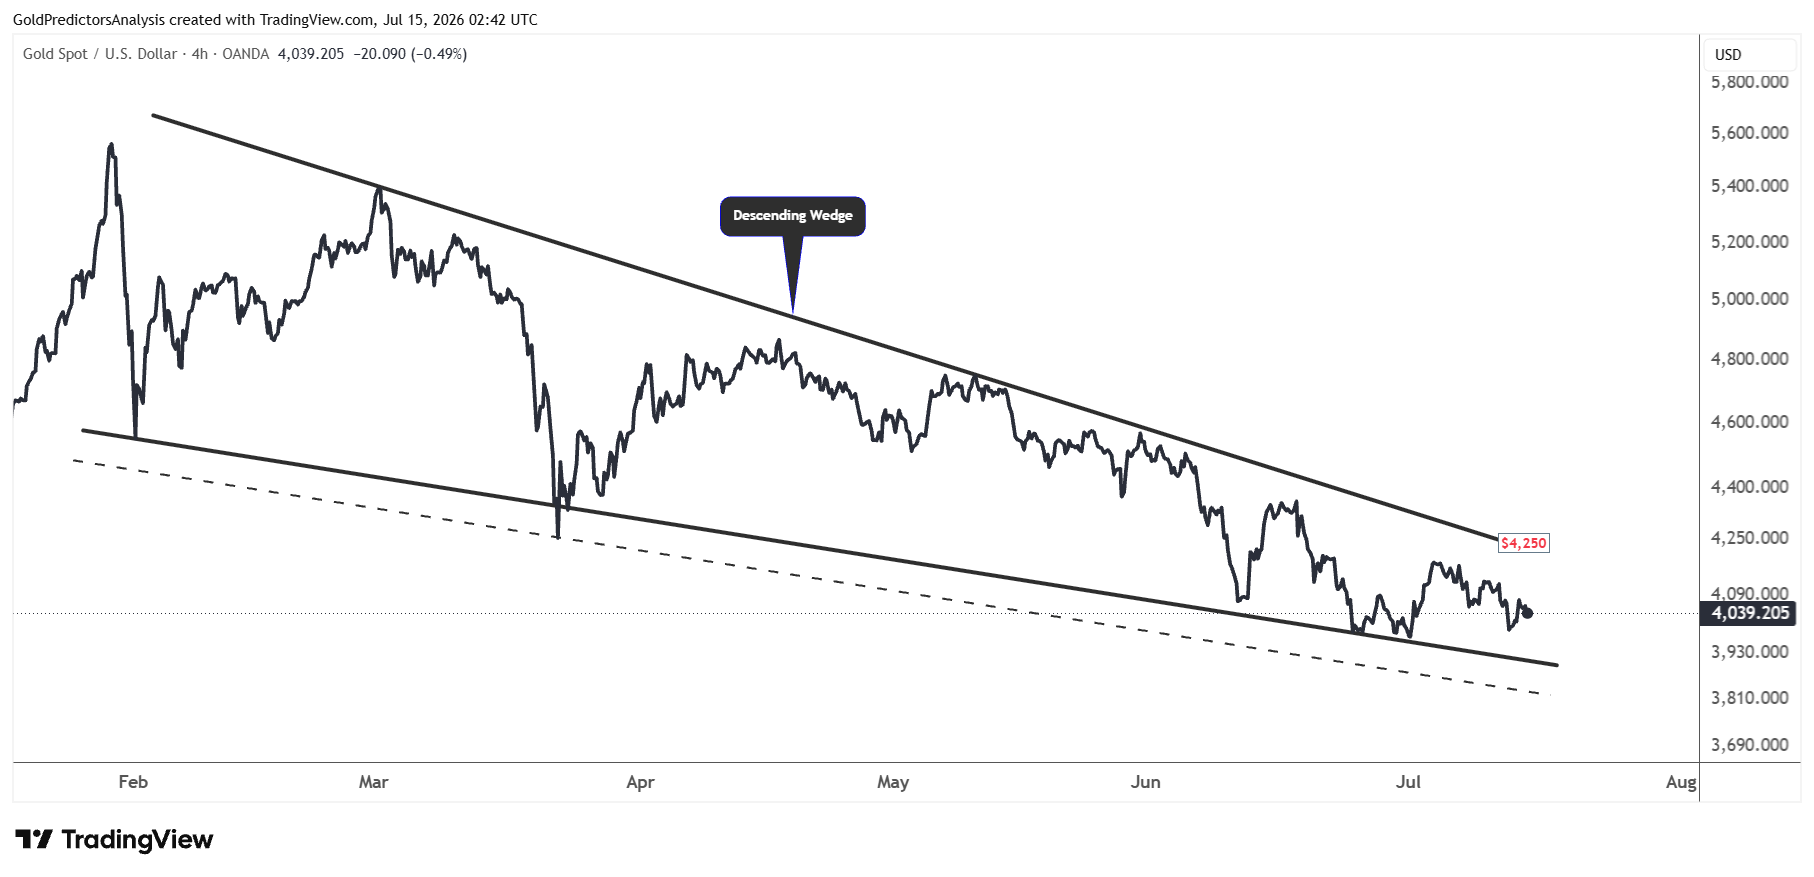
Spot gold prices rebounded higher after the inflation data, but the rebound was limited below $4,200. The price again continued lower and remains under bearish pressure. As long as the gold price remains below the $4,200 area in the short term, the likelihood of downside pressure will remain. The RSI has also reached the mid-level and indicates that prices may continue to consolidate at lower levels before the next move.
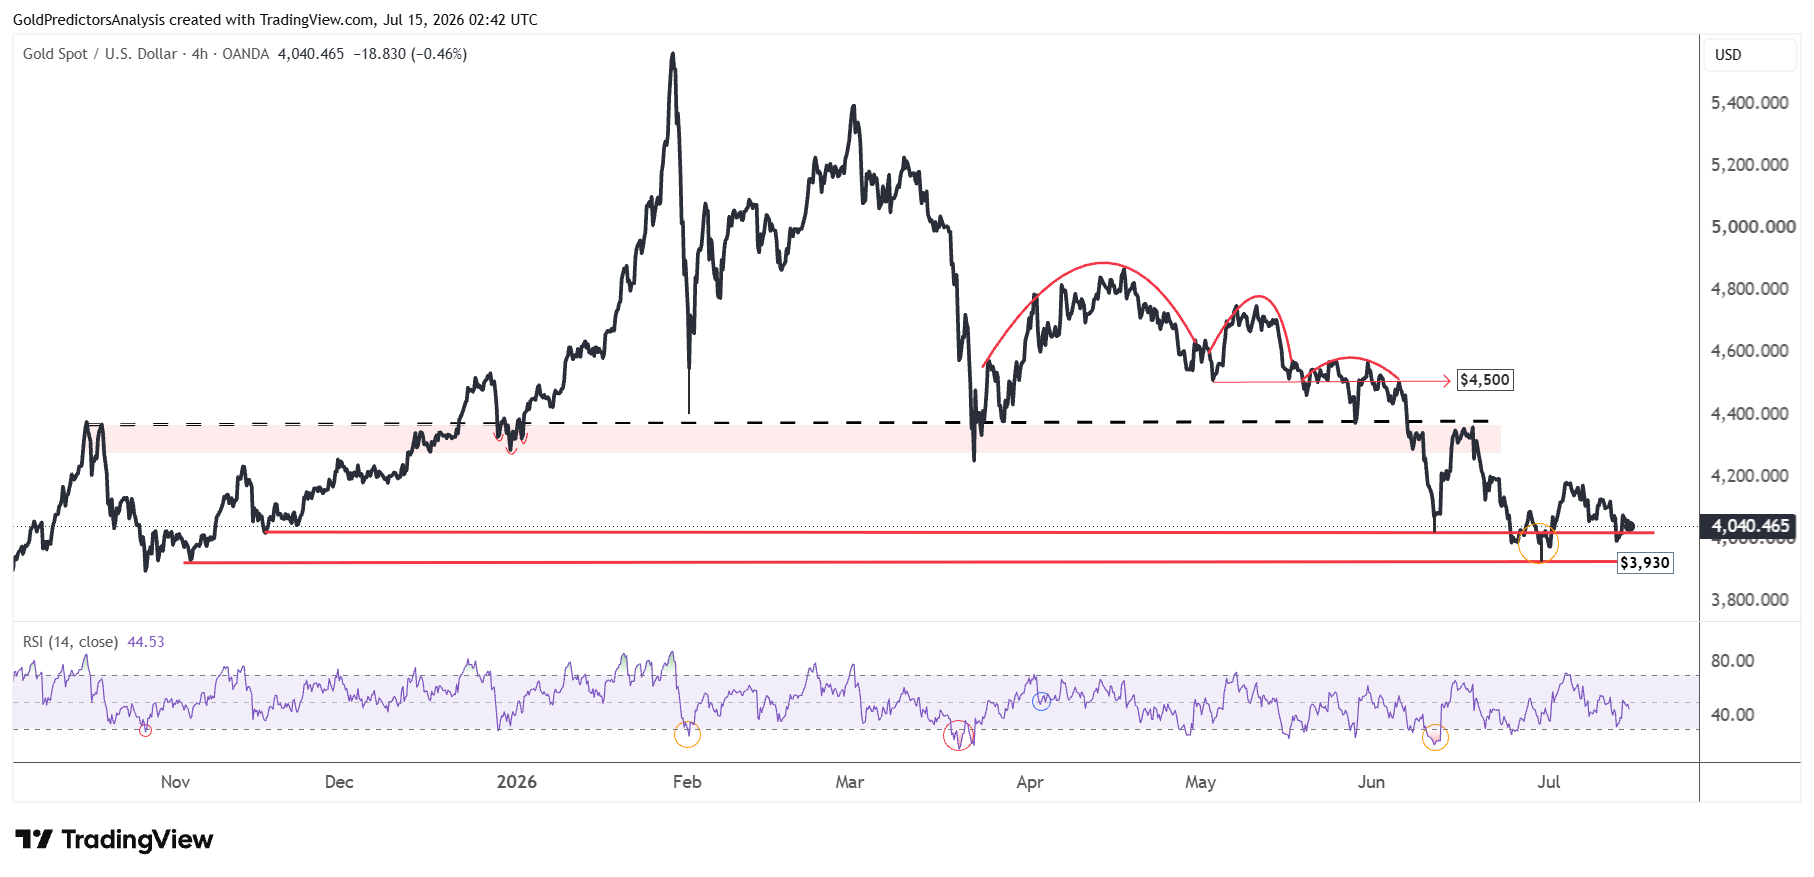
A confirmed break above $4,200 will indicate a quick rally to $4,350. The formation of the descending broadening wedge pattern since April 2025 highs indicates that prices remain under pressure until a clear breakout above $4,500 develops.
The failure of spot gold at $4,200 indicates that the gold market may again move towards $3,950. A break below $3,950 will indicate another drop towards $3,800. On the other hand, a break above $4,200 will push the price towards the black dotted trend line at $4,370 and the resistance of the descending broadening wedge at $4,500.
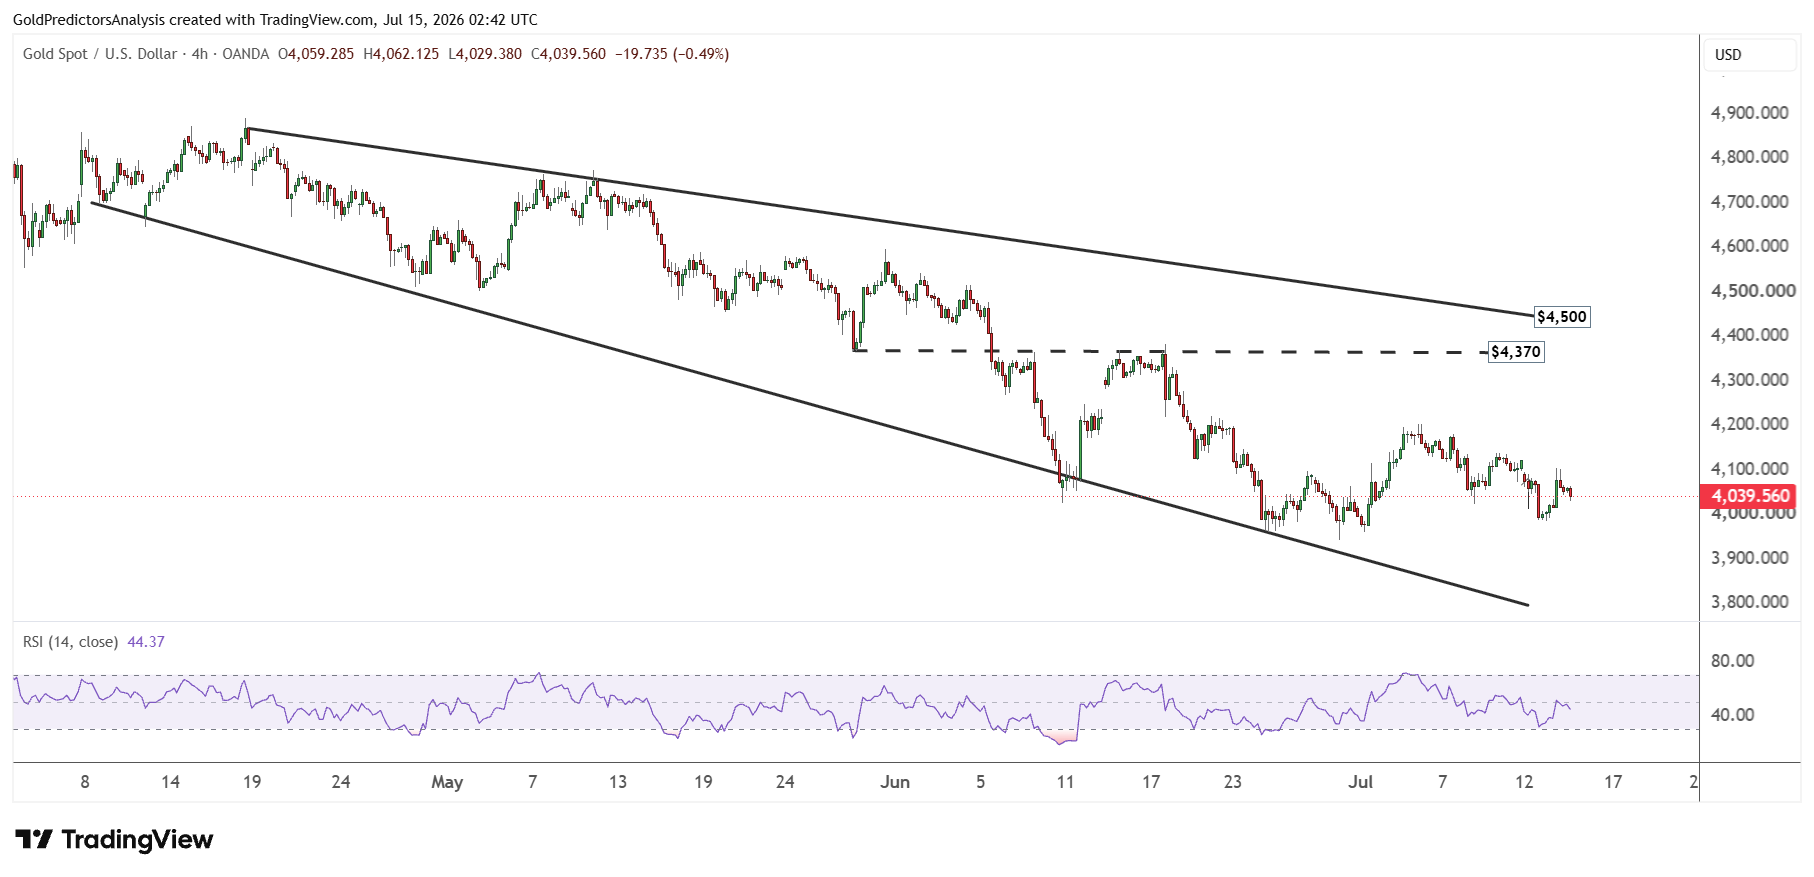
Another chart for spot gold shows that prices are now compressing within the edge of the descending wedge pattern. As prices move into July, the consolidation range might narrow down. This time period is famous for choppy and overlapping patterns. But a break above $4,250 will break the descending wedge pattern and open the door for a strong rally towards the $4,500 area.
Gold Price Forecast
Every new Gold analysis as it publishes, today's technical signal and key levels, live price — on one page.
See all Gold forecastsSilver Price Forecast: $55 Support Faces Breakdown Risk
The daily chart for spot silver also shows that prices are compressing between $55 and $64. This support zone is termed the primary support as illustrated in the chart below. However, if prices fail to break above $64 in the short term, then the likelihood of a downside breakdown below $55 will increase.
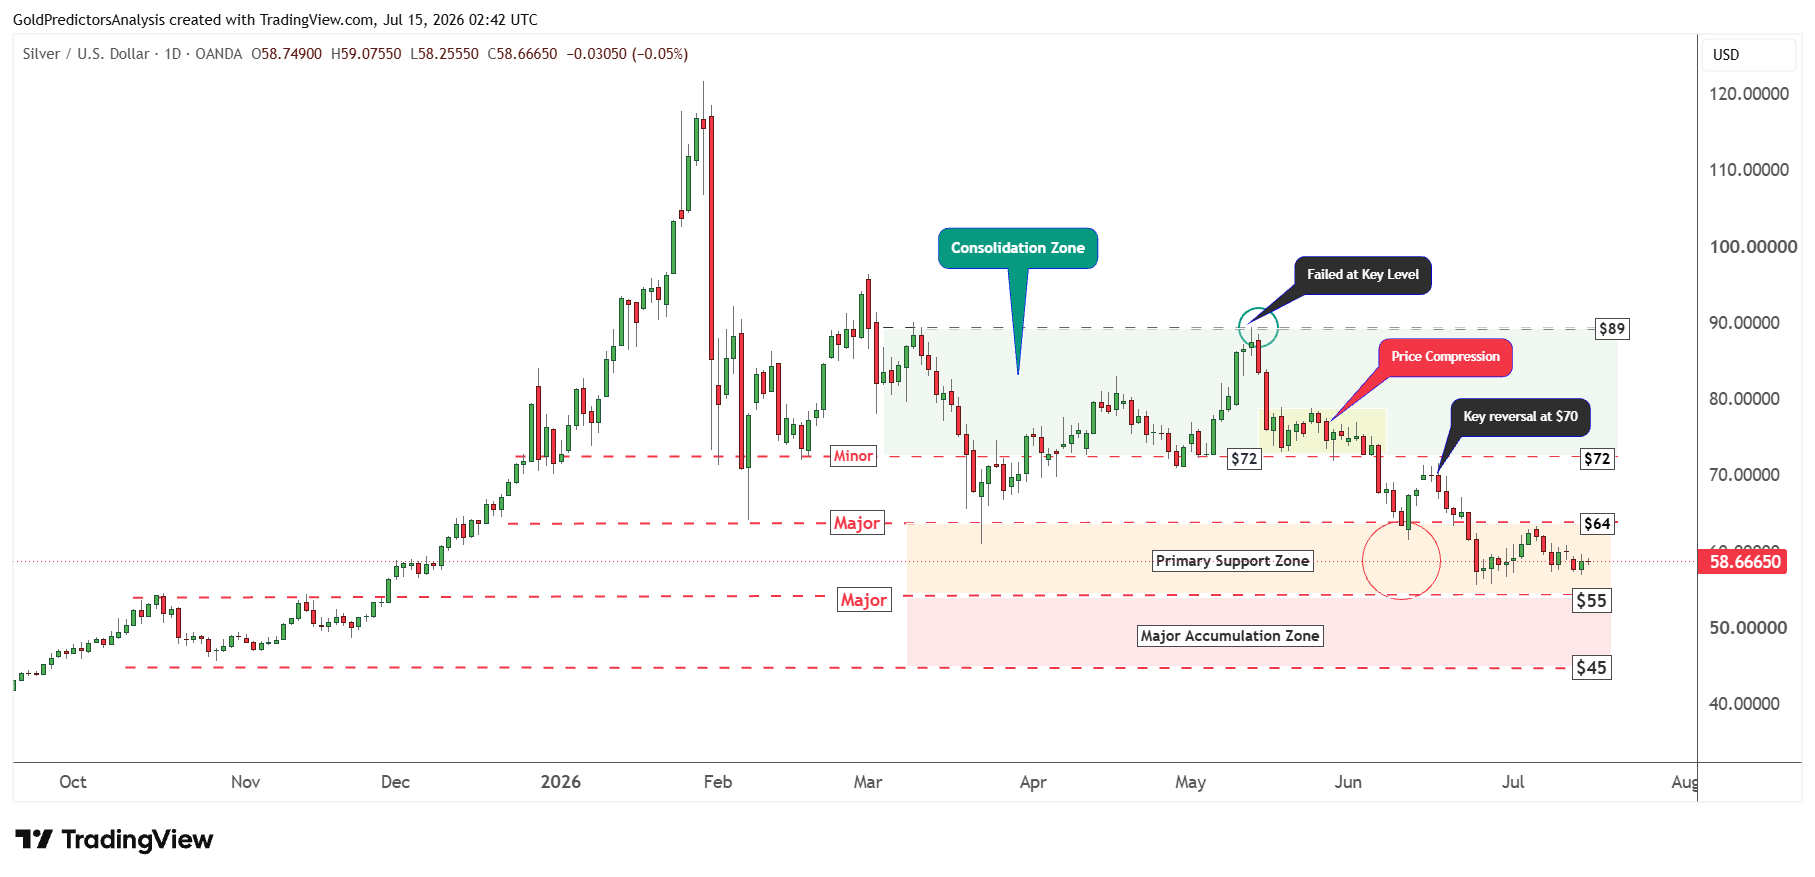
A break below $55 will push the price towards the long-term major accumulation zone between $45 and $55. This drop in the silver market will likely offer strong buying opportunity for investors and push prices back towards $90.
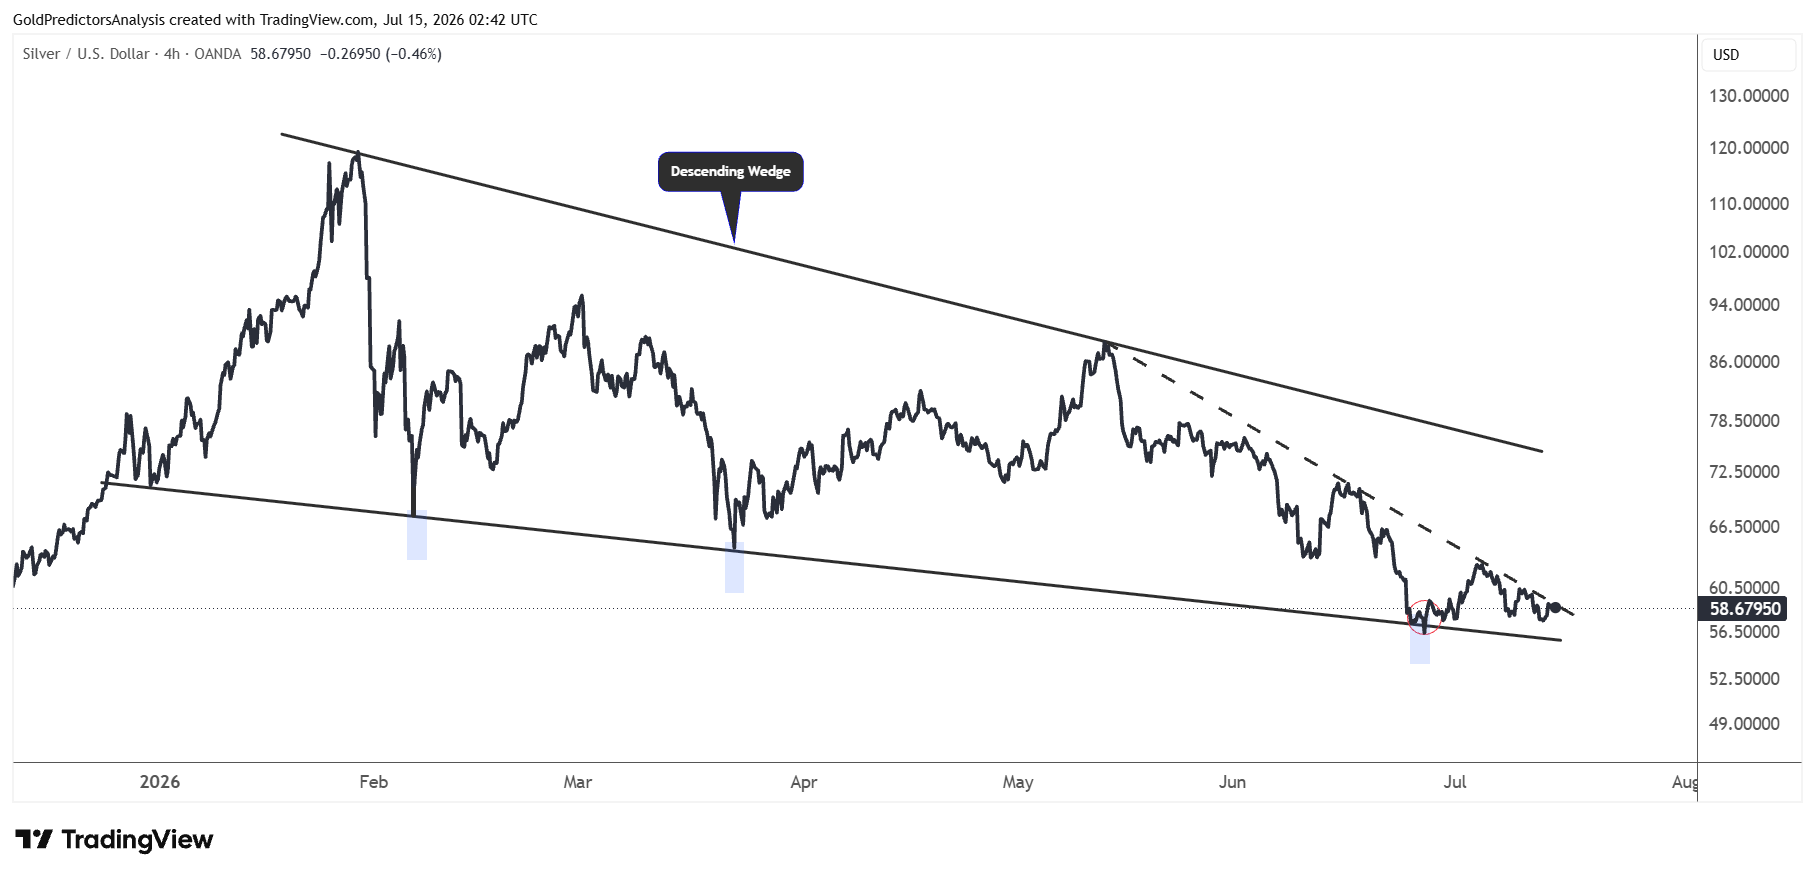
The 4-hour chart for spot silver shows the effect of the inflation data. But the prices still remain under pressure despite the rebound from the support. The immediate support remains at $55. A break below $55 will push the price towards the $50 area. The prices may continue to consolidate around the $55.
The chart below shows that the black dotted descending trend line extends from the May 2026 highs. The price remains below this trend line and indicates strong bearish pressure in the silver market.
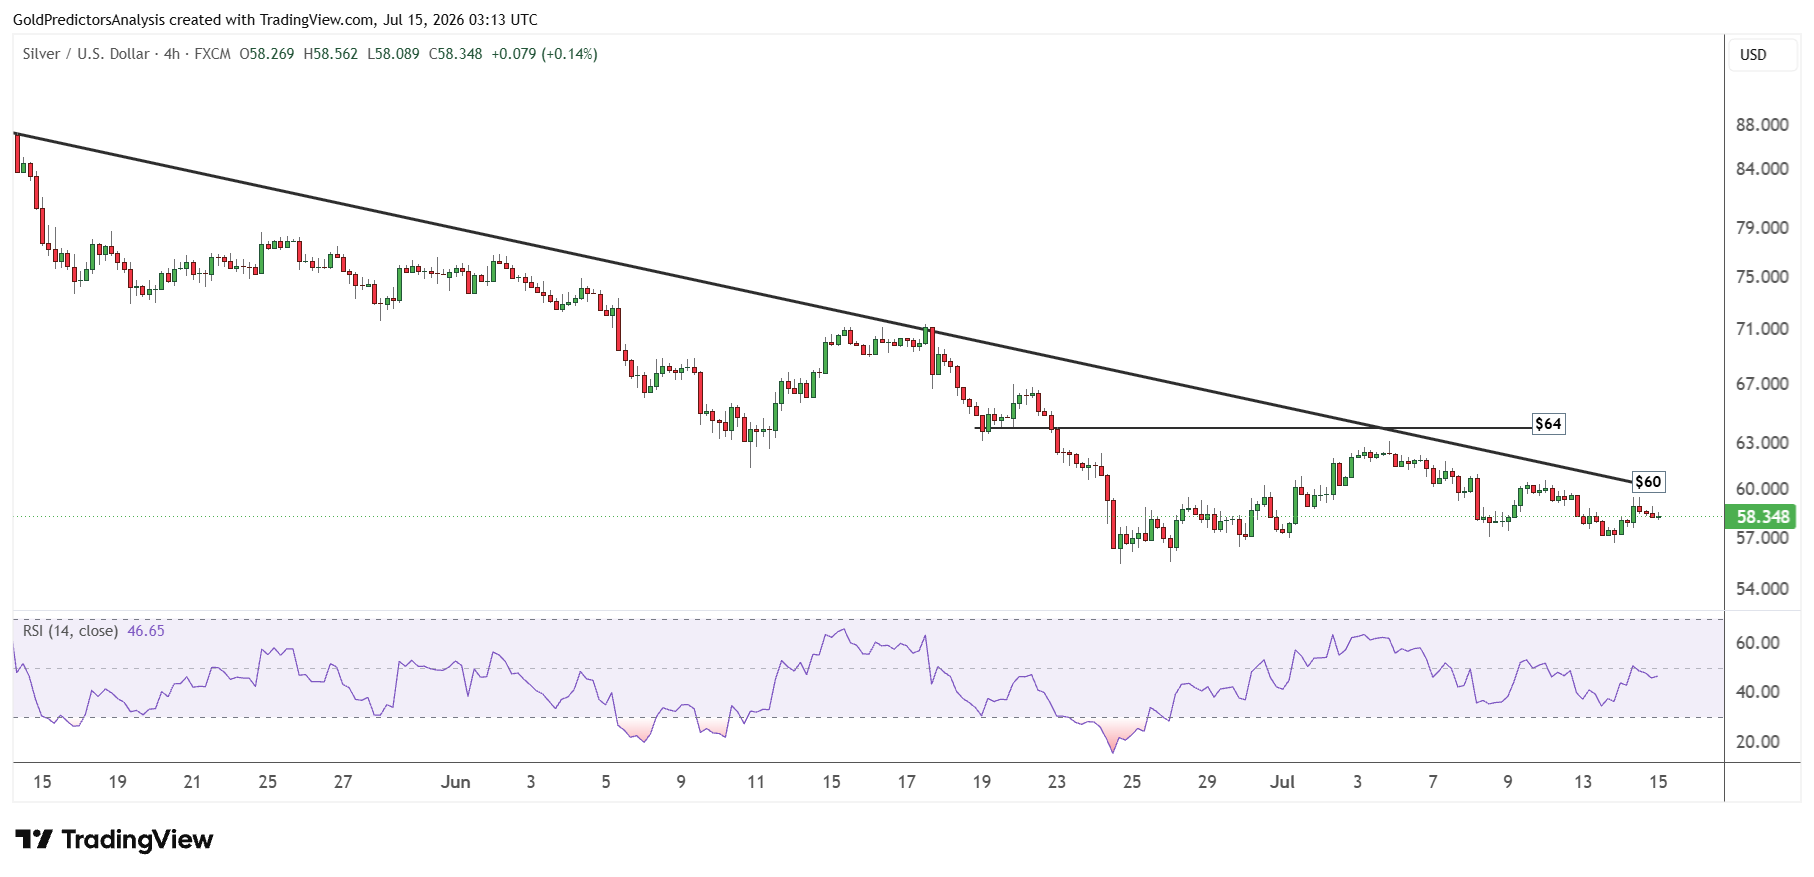
This descending trend line is also observed in another chart, which shows $60 as a short term resistance. A break above $60 will push prices towards $64. But a break above $64 is required to initiate the next move towards the $72 area in the short term.
The RSI remains below the midline following the rally after the inflation data, which indicates that short term momentum in spot silver remains under bearish pressure.
Final Thoughts
Gold and silver continue to trade in a range between easing inflation in the United States and the rising risks in the Middle East. The inflation data eases but the rising oil prices may bring the inflation back into the headlines. Gold needs to break above $4,200 and then $4,500 to indicate stronger upside momentum. But a break below $3,950 would indicate a move to $3,800.
On the other hand, the silver consolidates between the $55 and $64 zone. Silver needs to break above $64 to push the price to $72. The next major move in gold and silver will likely depend on the oil prices, inflation projections, and the Middle East conflict.


