Deep Support Zone Sets the Stage for Recovery
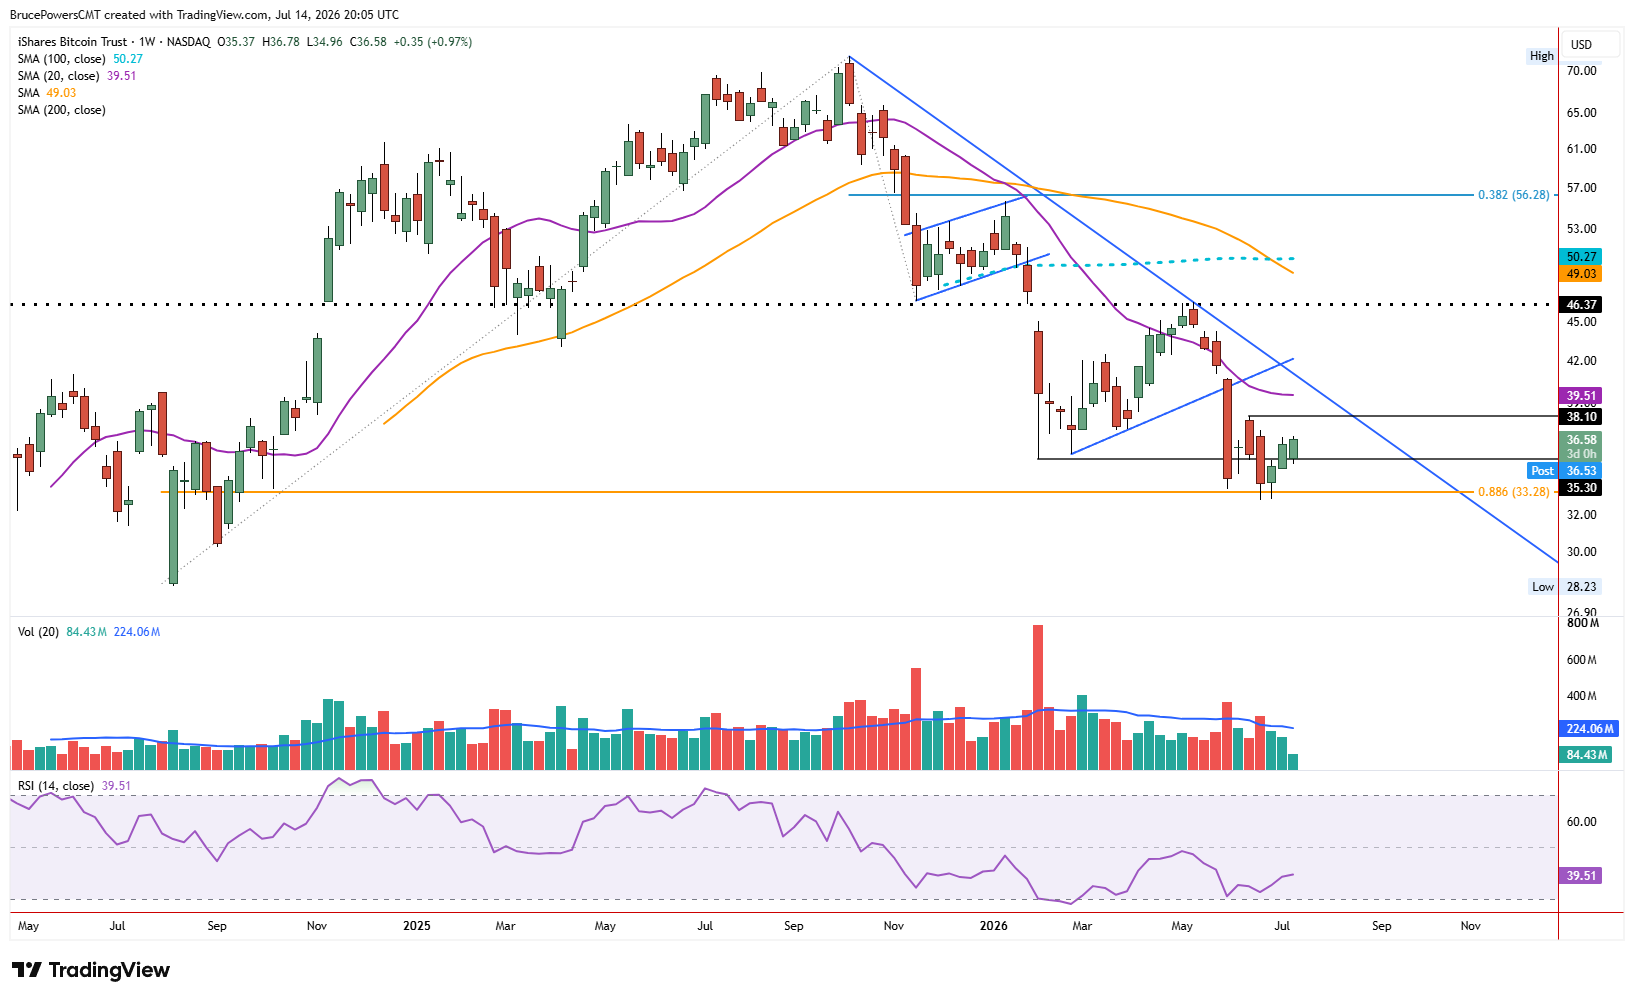
Shares of iShares Bitcoin Trust (IBIT) have been showing signs of strengthening over the past couple of weeks, which suggests further upside. It reached a corrective low of $32.84 three weeks ago, thereby completing an 88.6% Fibonacci retracement of the prior advance. That would represent one of the deepest commonly watched Fibonacci retracement levels before a correction turns into a failure. In other words, it is a key price zone where support may be seen that leads to either a tradeable bounce or a long-term bottom and higher swing low.

Weekly Momentum Begins to Shift
The support zone was confirmed over five weeks before renewed strength showed up and triggered a one-week bullish reversal of an inside week last week. An initial bullish continuation of that strength triggered today, Tuesday, with an advance to a high of $36.78, which was slightly above last week’s high of $36.66. Next up on the weekly chart would be the lower swing high of $38.10. A sustained advance above that level would trigger a bullish reversal of the short-term downtrend.
Short-Term Indicators Confirm Improving Strength
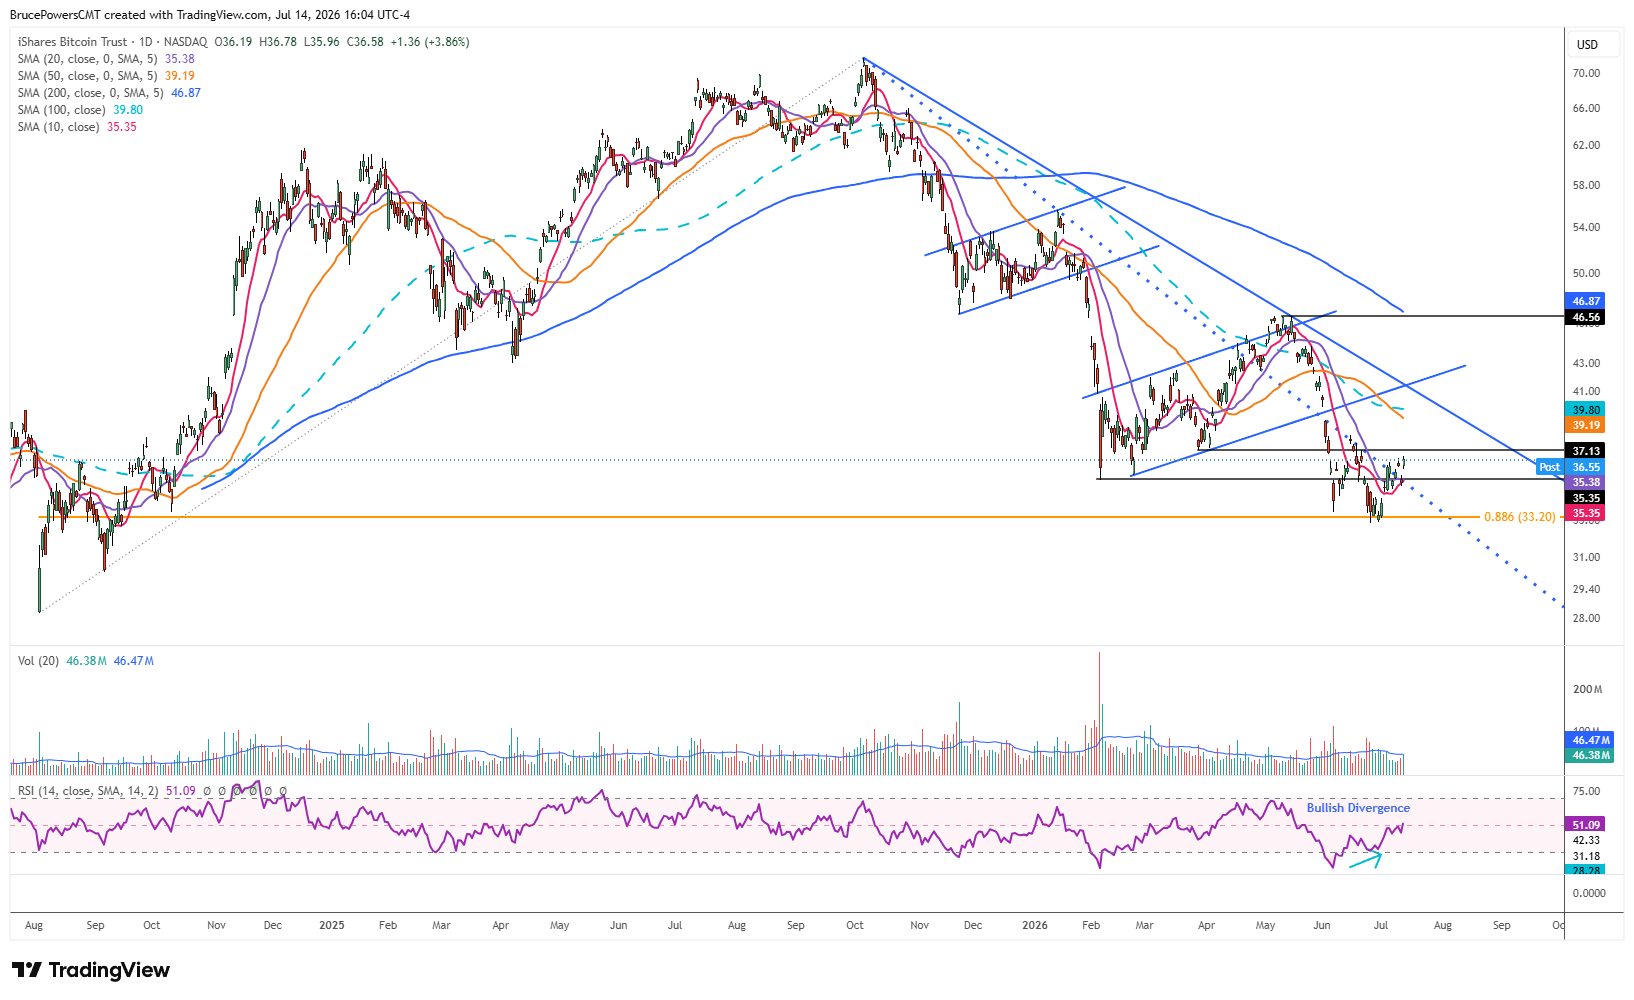
The daily chart shows additional details and bullish signs. On Tuesday, a second breakout above an earlier downtrend line was triggered. This further confirmed the reclaim of the 20-day moving average recently, as it was successfully tested as support again on Monday. In addition, improving short-term momentum was indicated by the 10-day moving average starting to cross above the 20-day moving average. The earlier downtrend line is being discussed since it was clearly defined by the market recently as resistance for approximately eight days, a sign of improving bullish momentum.
Resistance Levels Will Define the Next Trend Decision
Since IBIT is now moving away from the 20-day moving average, the 50-day moving average near $39.19 and falling becomes the next upside objective, along with the 100-day moving average near $39.80. A prior lower weekly high at $40.75 provides an initial upside target from structure. That high also marks the support zone that led to the breakdown from the bearish flag formation. A sustained advance into this resistance area would determine whether the recent recovery develops into a broader trend reversal or remains only a corrective bounce.
If you’d like to know more about technical analysis and how traders use it, please visit our educational area.