


Ethereum (ETH) has jumped by 5% in the past 24 hours as data showed that inflation in the United States decelerated in June.
The top altcoin rose past the $1,800 resistance as the annualized variation of the Consumer Price Index (CPI) sat at 3.5% or 30 basis points below analysts’ consensus estimate for the period.
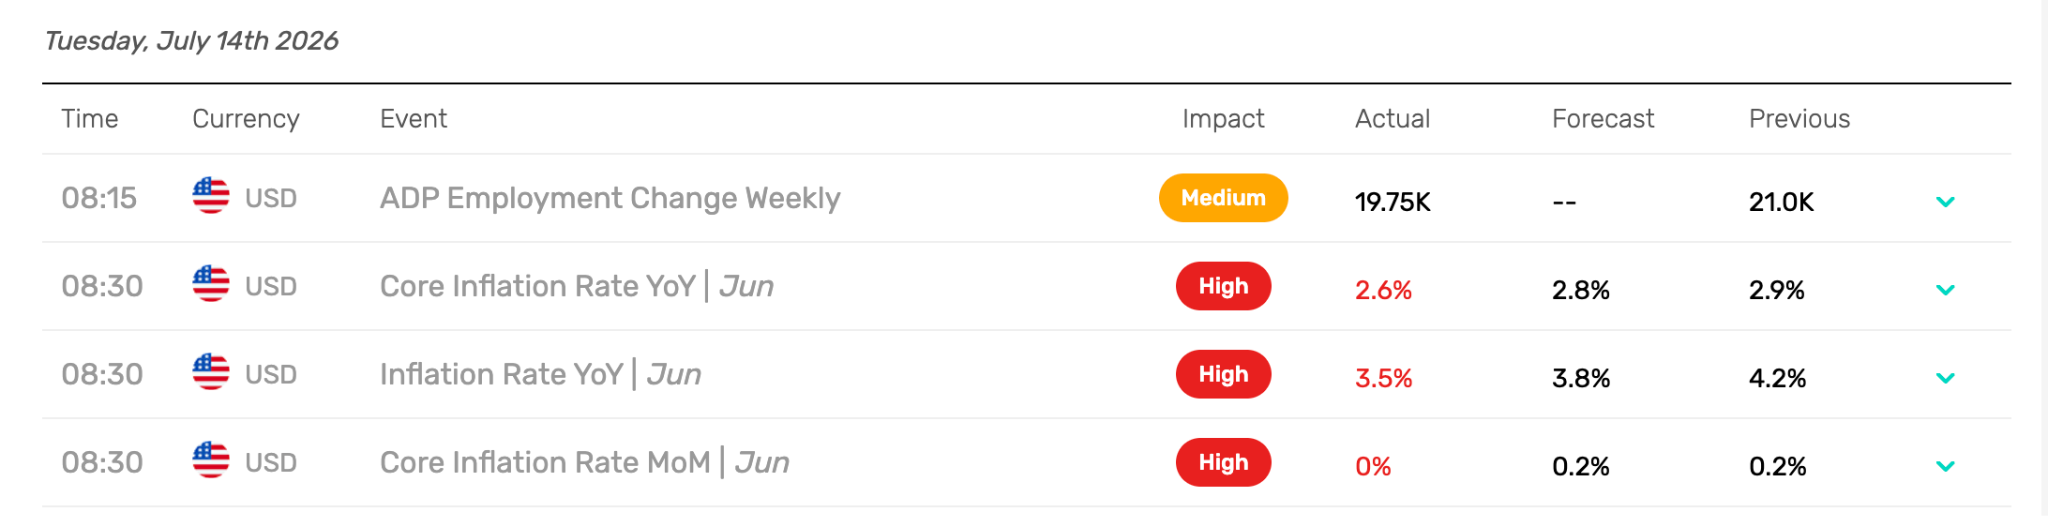
Meanwhile, prices retreated by 0.4% compared to the previous month instead of the 0.1% that economists were expecting. What’s more important, the annualized core inflation dropped by 20 basis points. Since this data excludes the impact of energy costs, it leaves out the impact of higher oil prices.
This explains why cryptocurrencies are booming today, as lower core inflation gives the Fed a reason to further delay an interest rate hike this year, or scrape it altogether.

Crypto Liquidations Spike After Break Above $1,800
Data from FedWatch shows that the odds that a rate cut won’t happen on September rose from 25% to 39% in just a day. Although still 61% of analysts are convinced that the Fed will raise rates by then, this is an interesting change in the overall perception of the macroeconomic backdrop.
Risky assets benefit from this kind of shift, and ETH’s case is particularly interesting as the token just broke above a key area of resistance and triggered a short squeeze along the way.
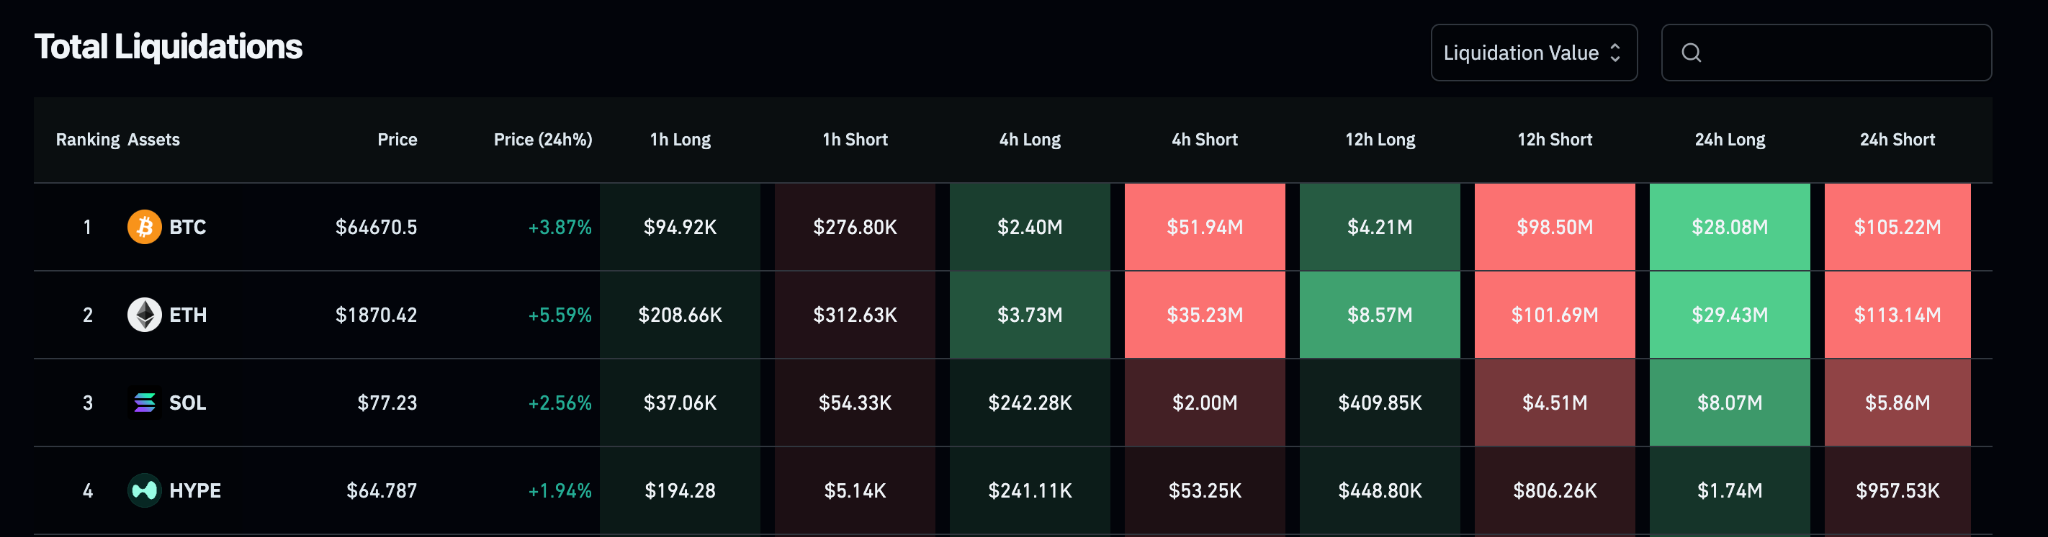
Data from CoinGlass indicates that nearly $300 million worth of short positions were blown up in the past 24 hours as a result of today’s uptick.
ETH is responsible for more than a third of that figure, surpassing BTC’s short liquidations temporarily. This confirms the technical relevance of this $1,800 threshold, and seems to indicate that a significant percentage of short orders were sitting above that mark.
Ethereum Price Forecast
Every new Ethereum analysis as it publishes, today's technical signal and key levels, live price — on one page.
See all Ethereum forecastsETH Will Face Its Toughest Test Once It Hits the 200-Day EMA
Heading to the charts, we signaled recently that ETH formed a double bottom at $1,550 and bounced strongly off that mark shortly afterward to confirm the relevance of this demand zone.
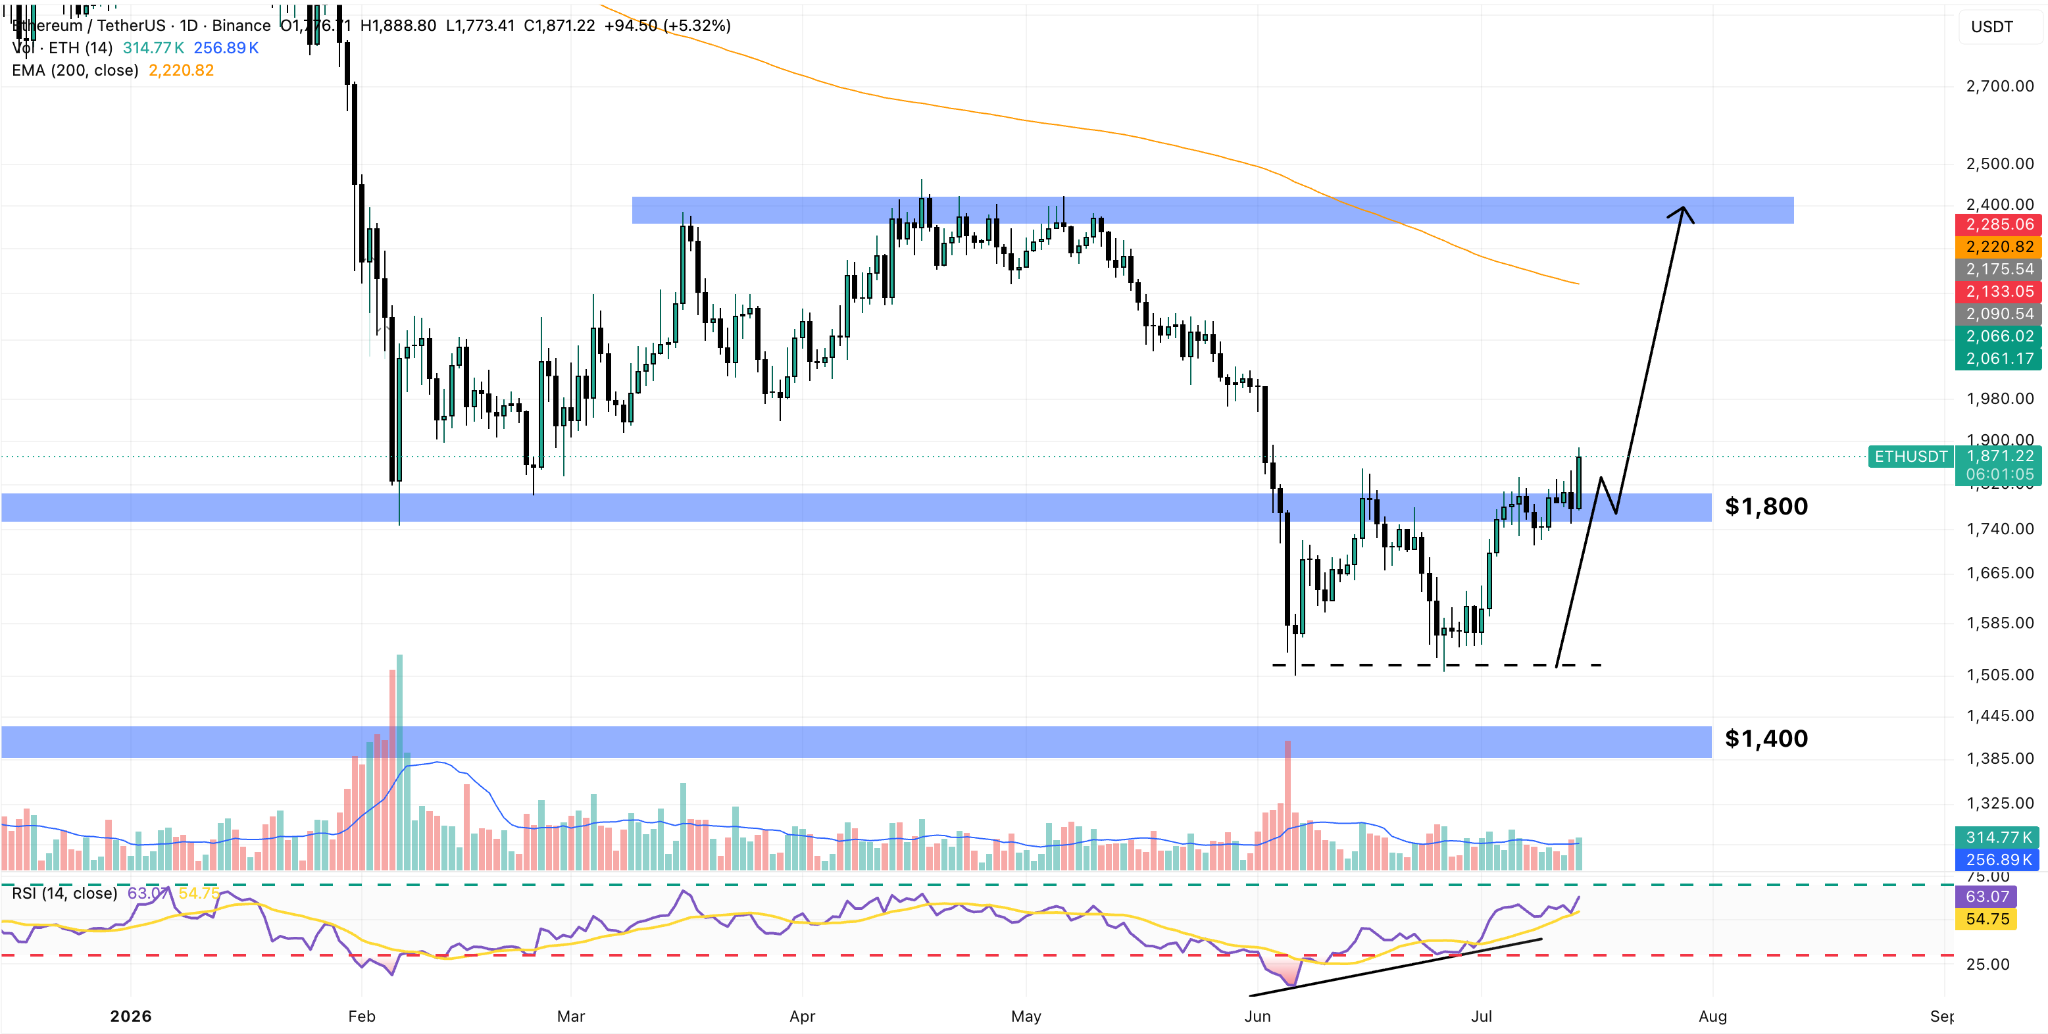
However, to confirm that pattern’s bullish bias, the price had to rise past $1,800 (the neckline), and that is exactly what’s happening today.
In addition, we also identified a bullish divergence in the daily Relative Strength Index (RSI). This indicates that, even though the price of the asset was declining, negative momentu decelerated.
Even though this is not a buy signal per se, it does reflect that the selling pressure has declined, and that the strength of the downtrend is progressively diminishing.
Above-average trading volumes, up 33% in the past 24 hours alone, also help confirming that this could be the beginning of an uptrend for ETH that could push it to the next key level at $2,200.
This is where the 200-day exponential moving average (EMA) currently sits and is probably the target that bulls will set their eyes on in the next few days.
Ultimately, we believe that a break above this level could push the token to $2,400 and mark the end of this bear market. This coincides with a long-dated buy signal in the weekly chart that popped up after the RSI dropped below 30 in that lower time frame.


