Support Zone Becomes the Immediate Battleground
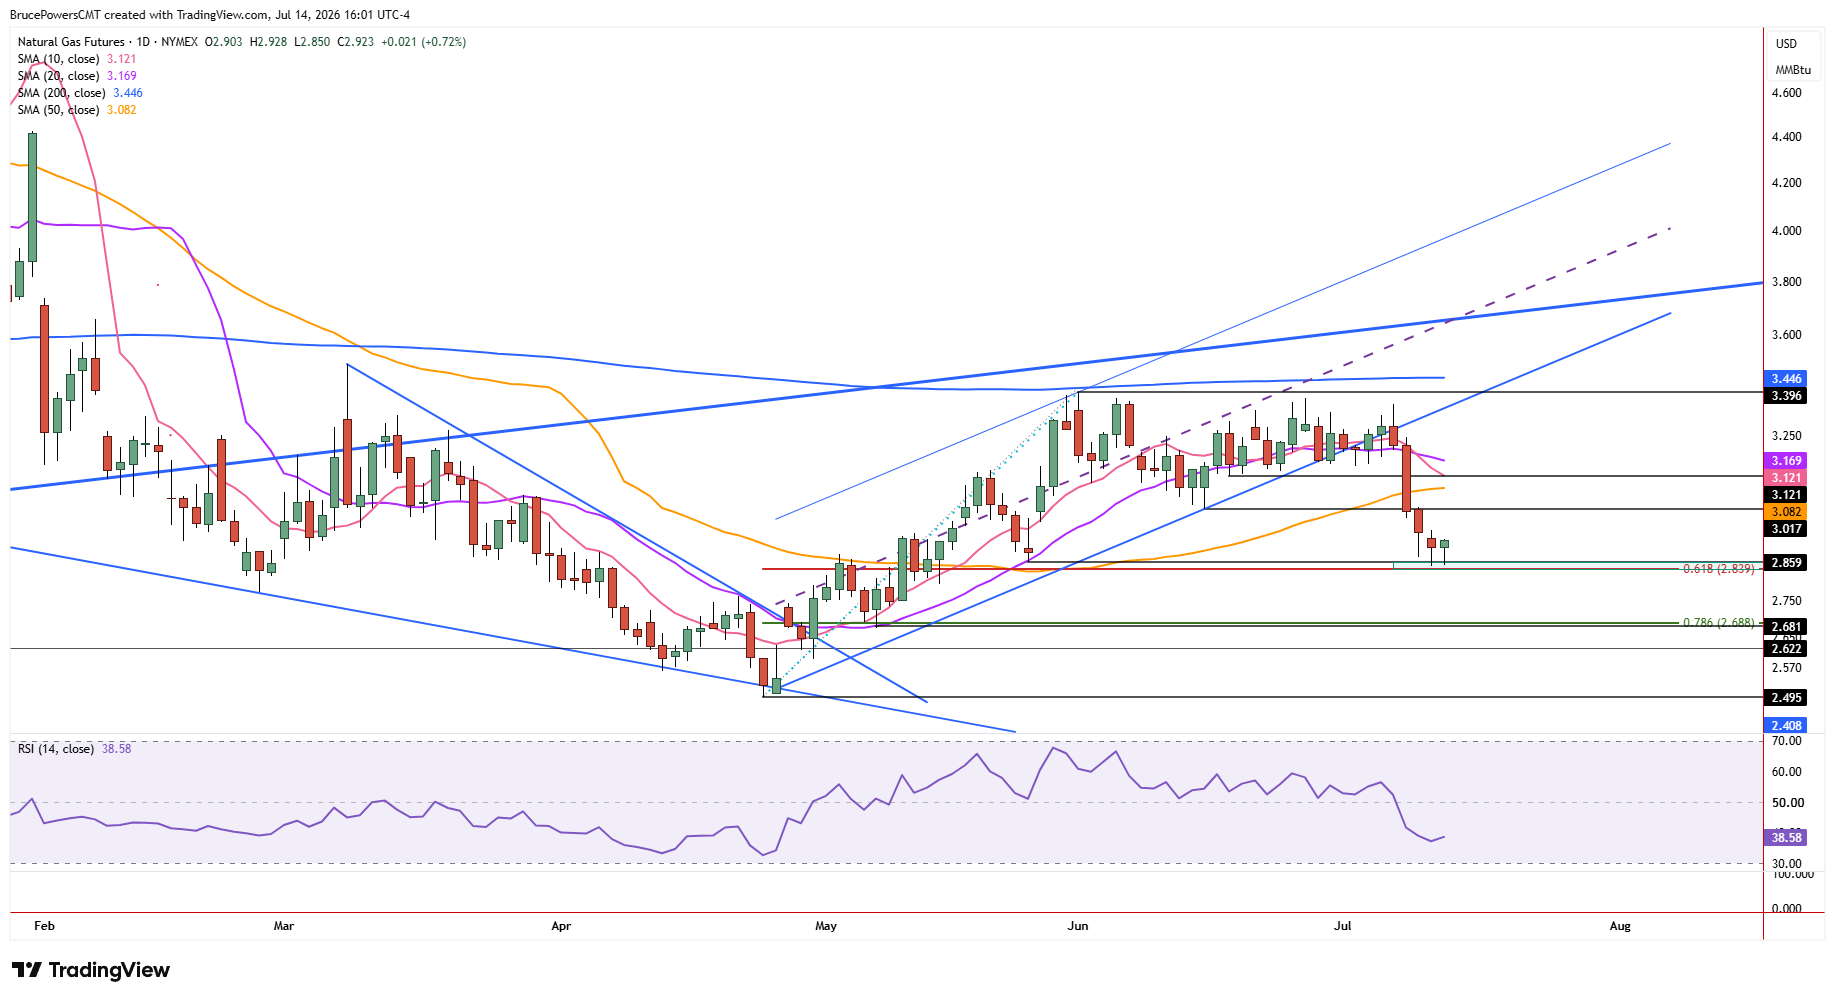
Further testing of a potential support zone continued for natural gas on Tuesday, with trading for the session contained within the range established on Monday. A lower daily high of $2.93 was established and a slightly higher daily low of $2.85 was recorded. The low for the bearish correction was hit on Monday at $2.85, while the prior session’s lower daily high was at $2.95.

Early Signs of Support
The current support zone is marked between $2.86 to $2.85, defined by a prior higher swing low and the 61.8% Fibonacci retracement of the full advance that followed the April low, respectively. It has been tested for three days now, beginning last Friday. The inside day pattern from Tuesday provides an early signal of potential strength if a breakout follows above the session’s high. Greater conviction from buyers would then be indicated on a decisive advance above Monday’s high, as it would provide a potentially more reliable one-day reversal signal.
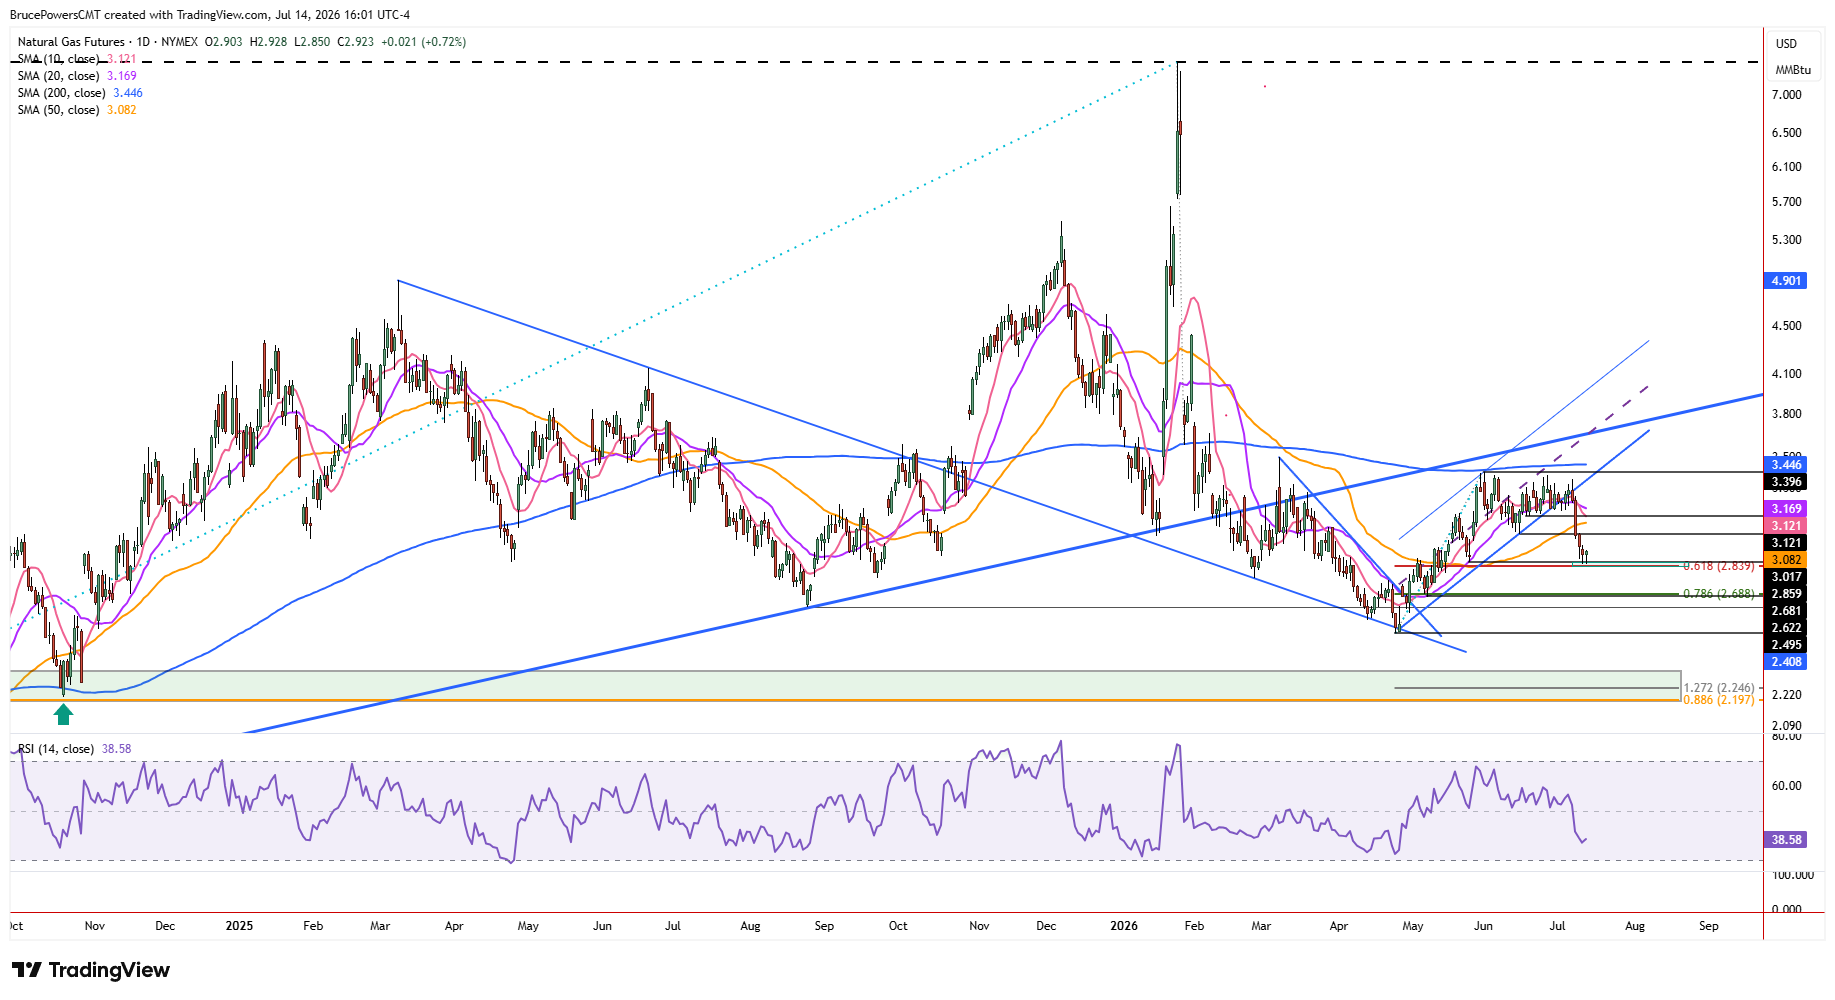
Initial upside targets for a bounce from support are near the prior swing low at $3.02, the 50-day moving average near $3.08, a prior interim swing low of $3.12, and the 20-day moving average, now at $3.17 and falling. The characteristics of the first upside pullback following the breakdown from the 50-day moving average should provide insight into changing demand. Once the first pullback is complete, the larger bearish trend structure suggests further downside may be likely.
Bearish Structure Still Threatens Lower Targets
Last week’s breakdown from a rising trend shows the completion of a pullback to test prior long-term dynamic support as resistance. Both the uptrend line and 200-day moving average, which act as trend indicators, were confirmed as resistance, resulting in a new lower swing high for the developing bearish trend. That suggests an eventual downside continuation.
Nonetheless, the recent support test certainly improves the chance for support to eventually be tested near the next lower target zone defined by the 78.6% Fibonacci retracement of the prior advance at $2.69 and a higher swing low of $2.68. Whether buyers can defend the current $2.85-$2.86 support zone will determine if natural gas can attempt a short-term recovery or if the broader bearish structure resumes toward those lower targets.
Natural Gas Price Forecast
Every new Natural Gas analysis as it publishes, today's technical signal and key levels, live price — on one page.
See all Natural Gas forecastsIf you’d like to know more about how to trade natural gas, please visit our educational area.